Root Cause Analysis Overview
Root Cause Analysis Defined
The Root Cause Analysis feature analyzes the relation between any of these involved metrics and get to the next level of detail behind any fluctuations. Through this feature you can get to the lowest granular level where the problem or the opportunity exists.
The Root Cause Analysis takes you through a guided flow to understand all the parameters that have impacted your GMV. It can be a particular Campaign, Channel, SKU or a particular step in your journey that has impacted your GMV.
The feature shows you a critical path by highlighting the most impactful nodes in red or green so they can be addressed later.
eCommerce Equation The Backbone
To look deeper into the reasoning behind any changes in the eCommerce metrics, be it positive or negative, we have taken the key metrics in the eCommerce equation to be the backbone of this analysis.
Revenue = Traffic x Conversion Rate x AOV
You can drill into each of these above metrics to understand how they perform and impact the GMV for a Channel.
Video Walkthrough
Steps to access Root Cause Analysis
Click on Analyze > Dashboard > Root Cause Analysis
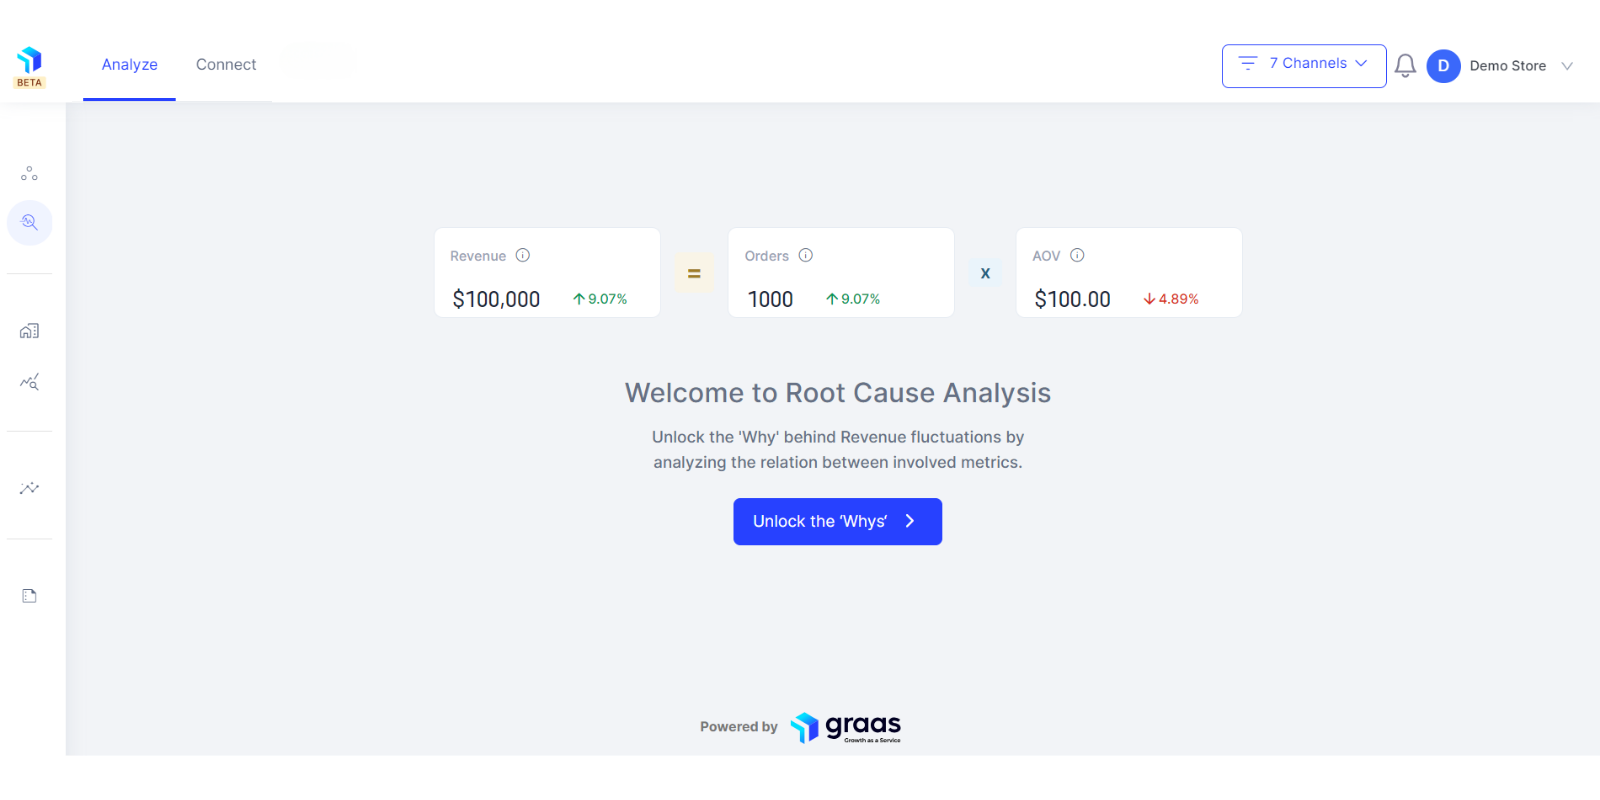
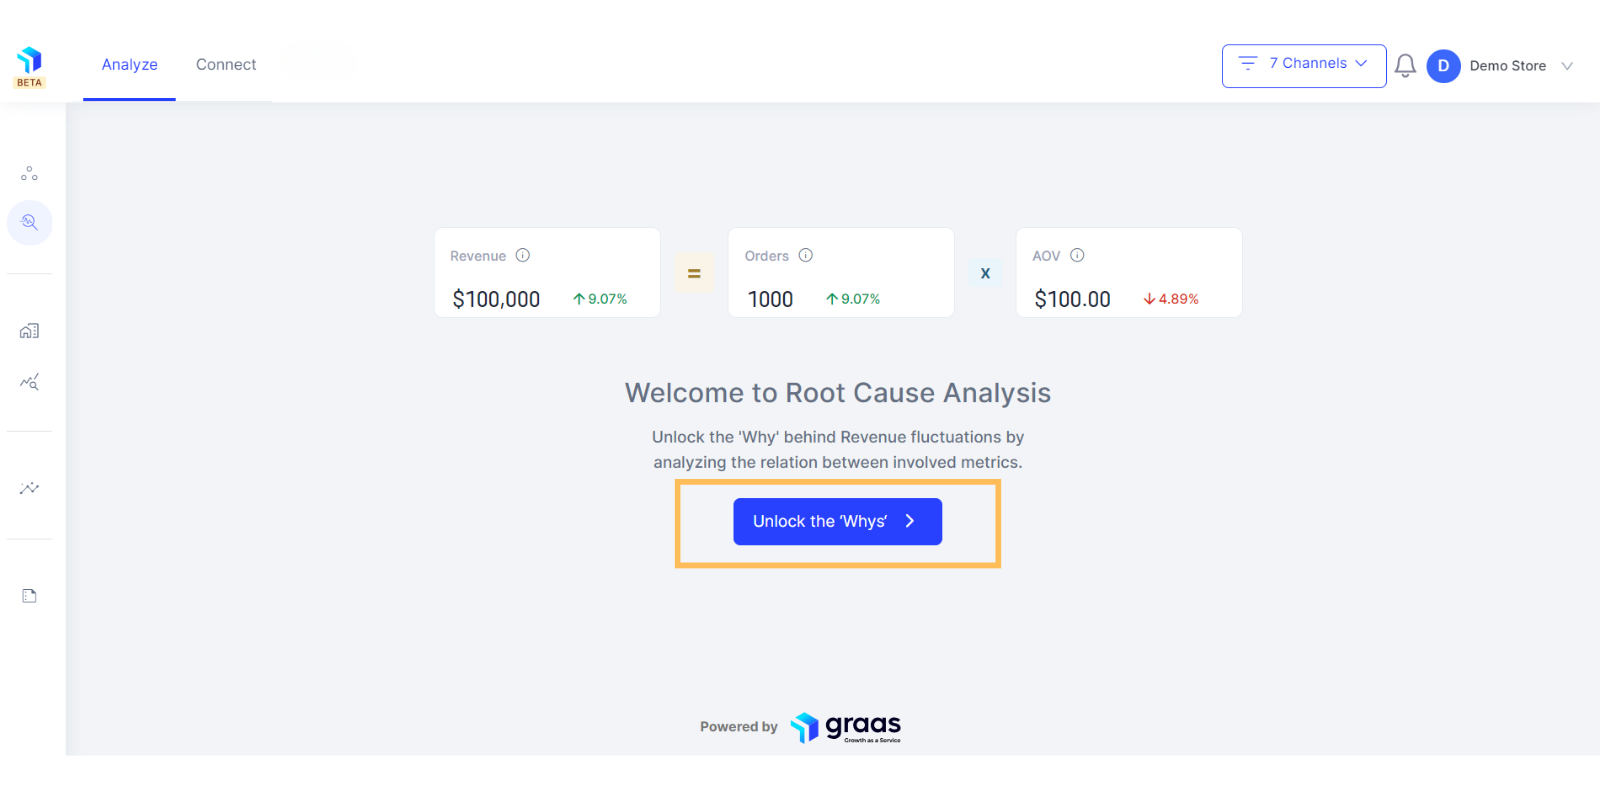
1. Click on the Unlock the Whys button on the landing page to explore the areas of concern and get to the root cause of change in Revenue.
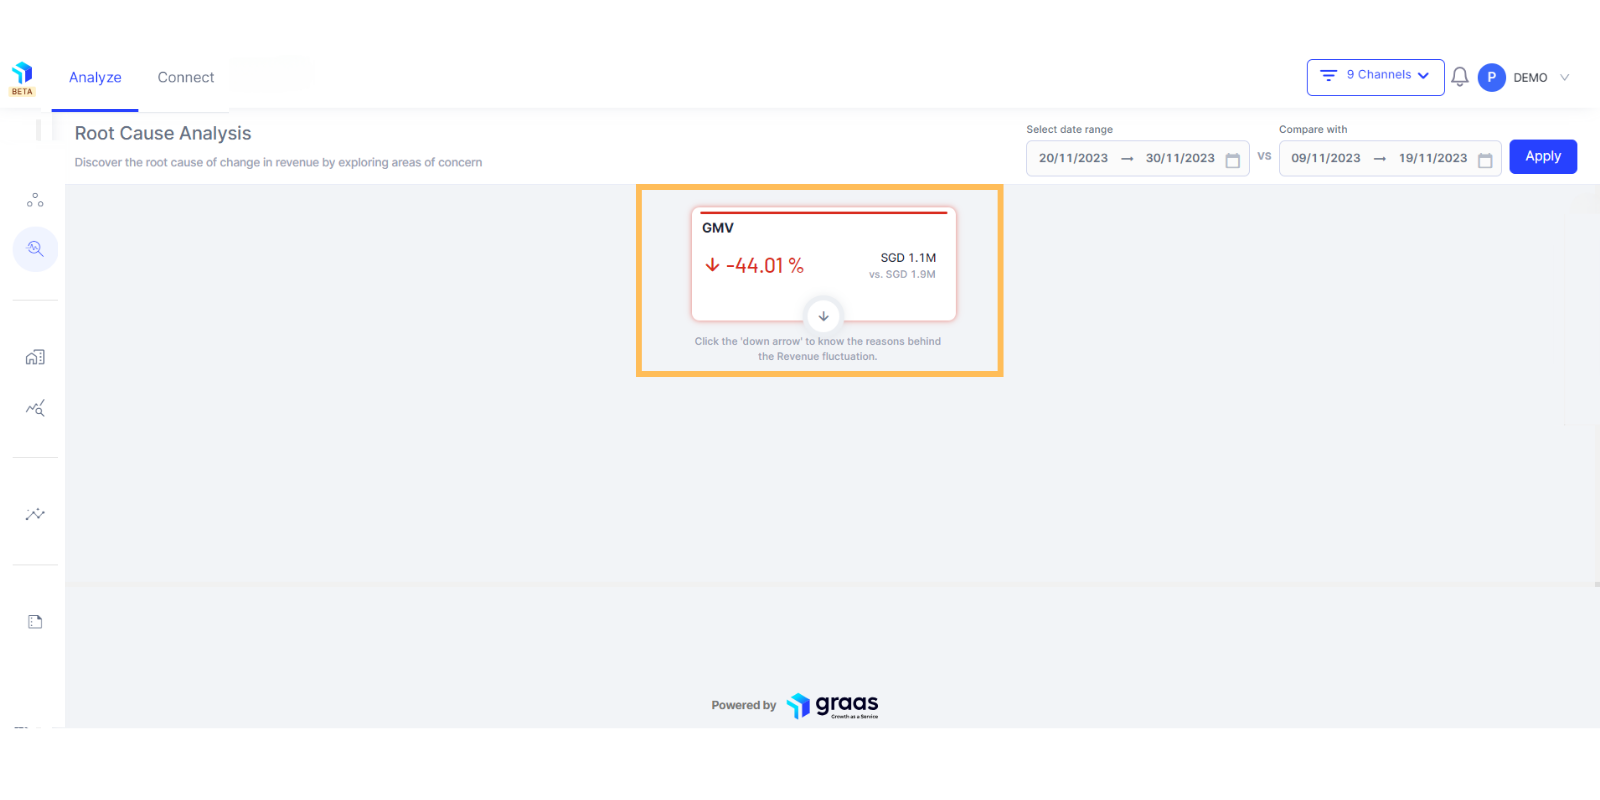
2. GMV will appear as the default metric on the next screen and you can start digging deeper about the reason for a drop or increase in the GMV by clicking on the down arrow.
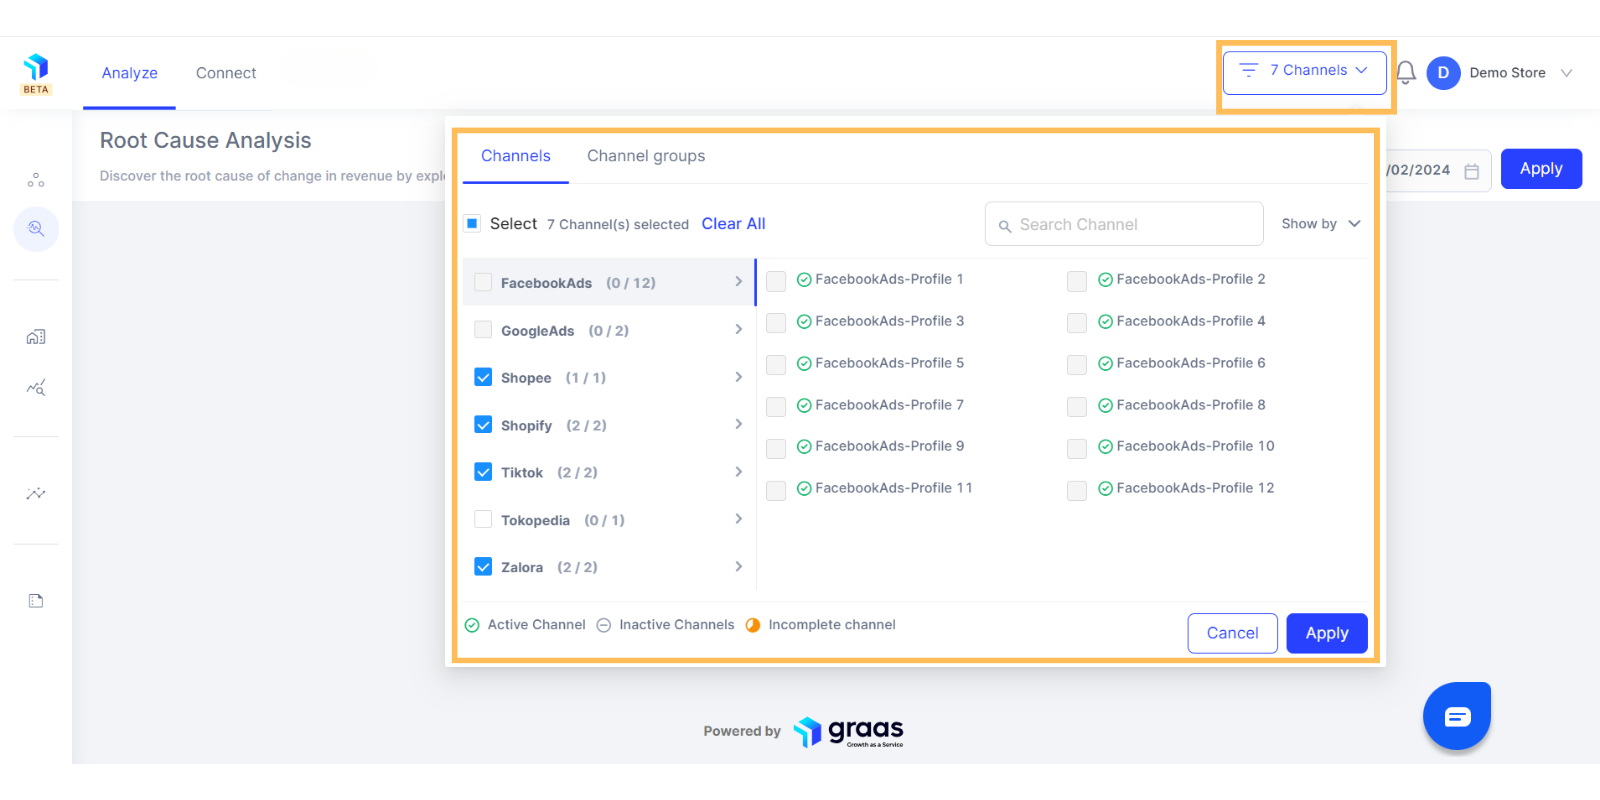
3. Before you do that, click on the Channels drop down on the top right to select the Channels or Channel Groups you want to include in this analysis.
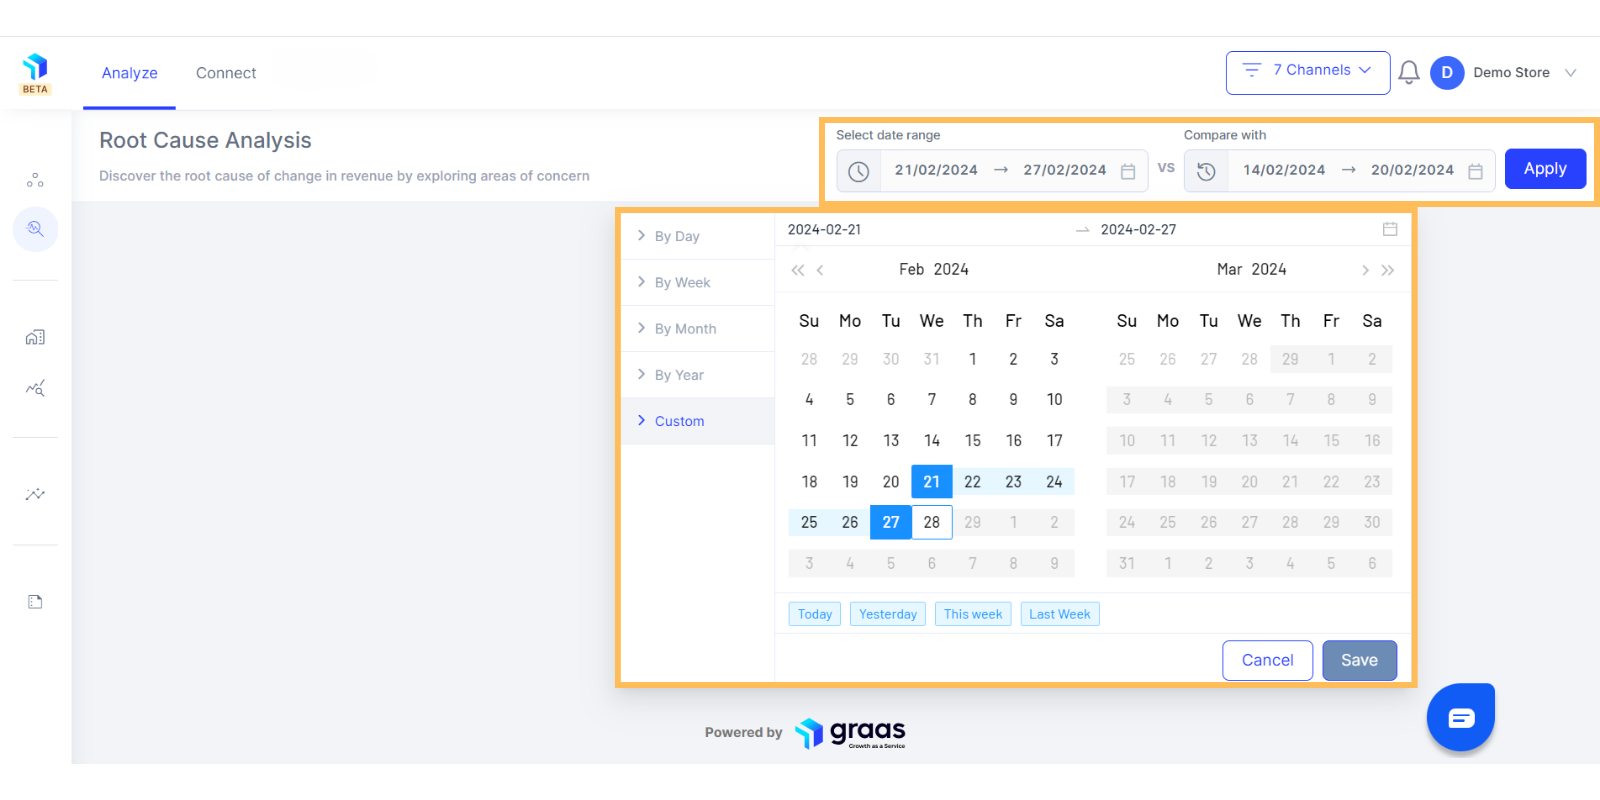
4. And select a date range for which you want to analyze the reasons for GMV changes.
5. Once you click on the down arrow, you will see the key Channels that have contributed to the change in the GMV (revenue) metric.
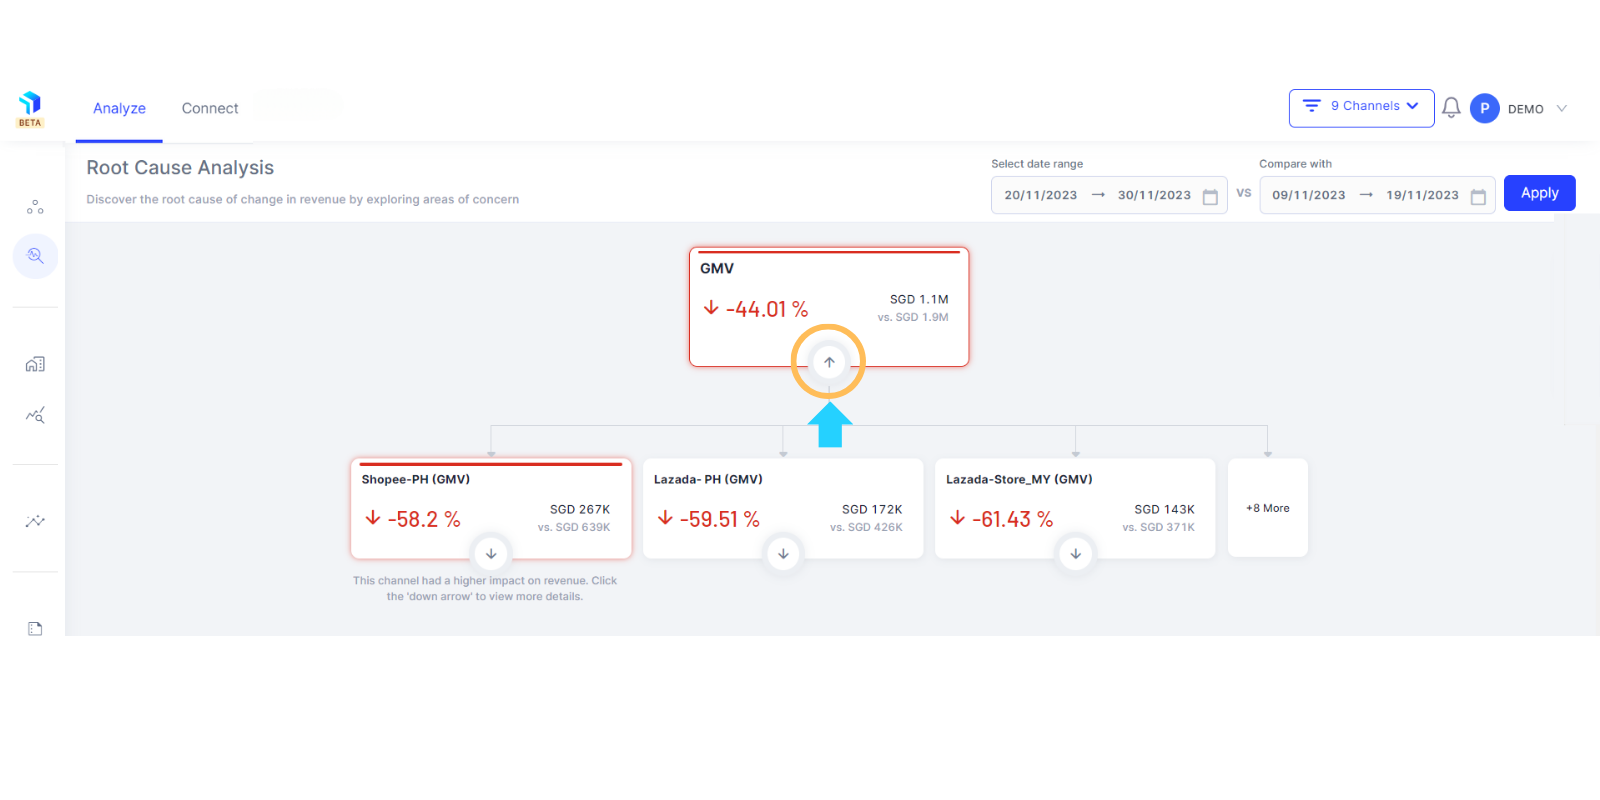
6. The Channel resulting in the maximum impact on Revenue has a red color line at the top of the box.
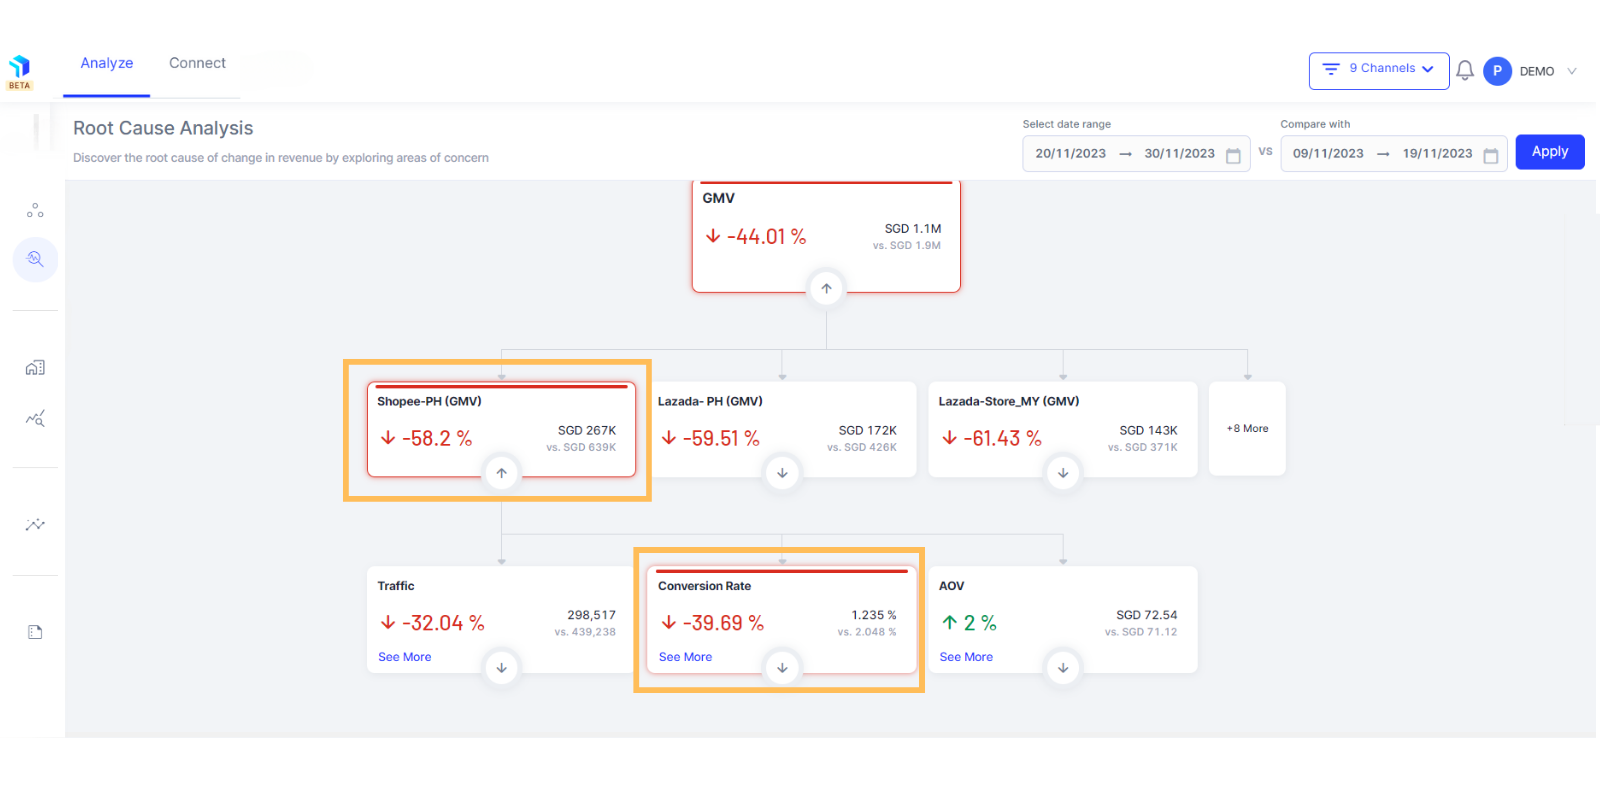
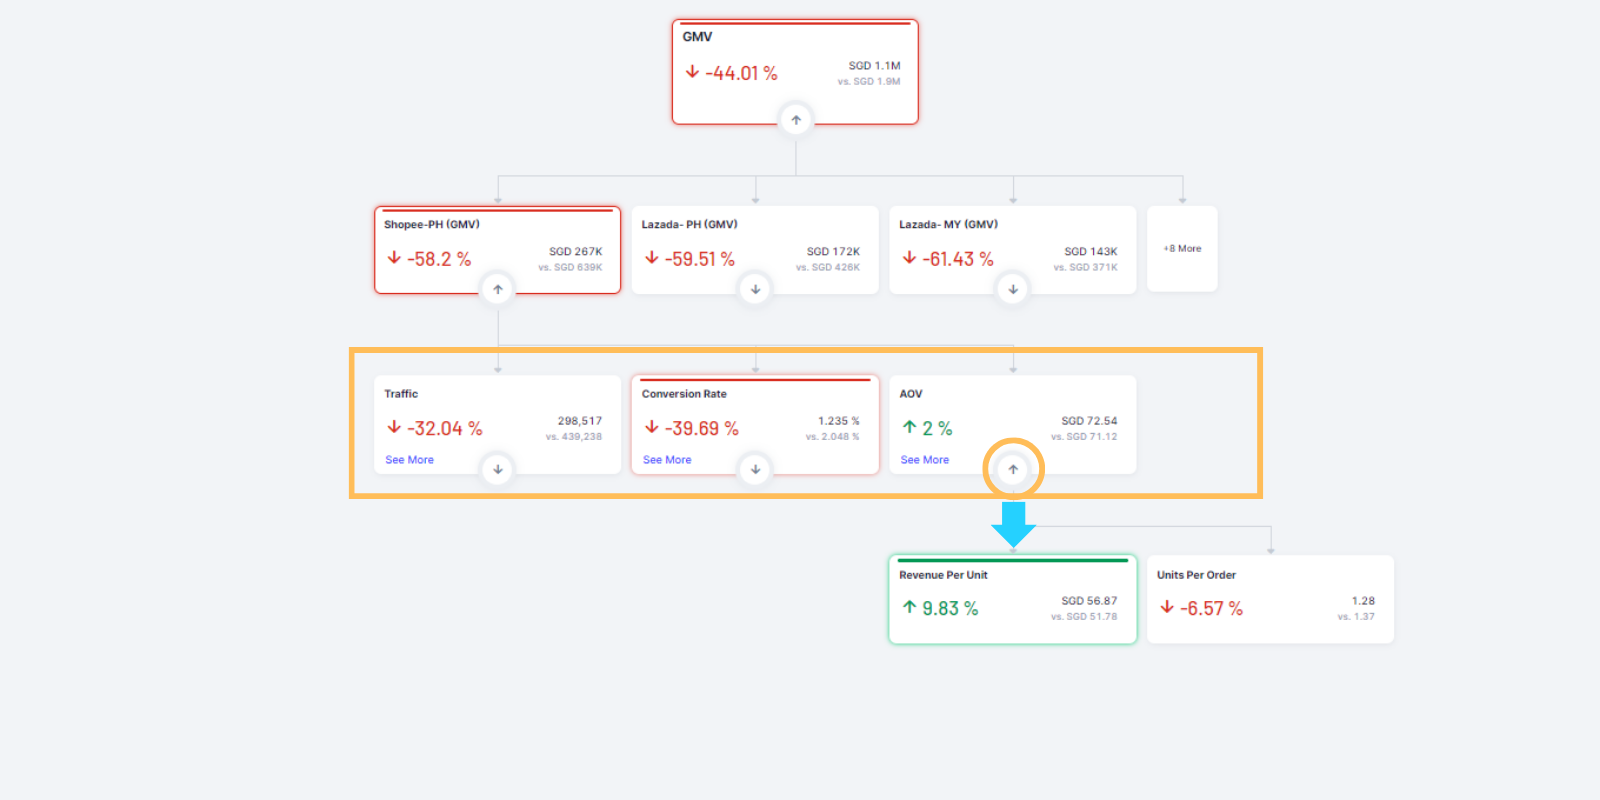
7. To drill deeper into the reasoning for this high impacting channel, click on the down arrow and you will see the three key metrics in the eCommerce equation displayed for each channel, pointing you in the direction of the problem.
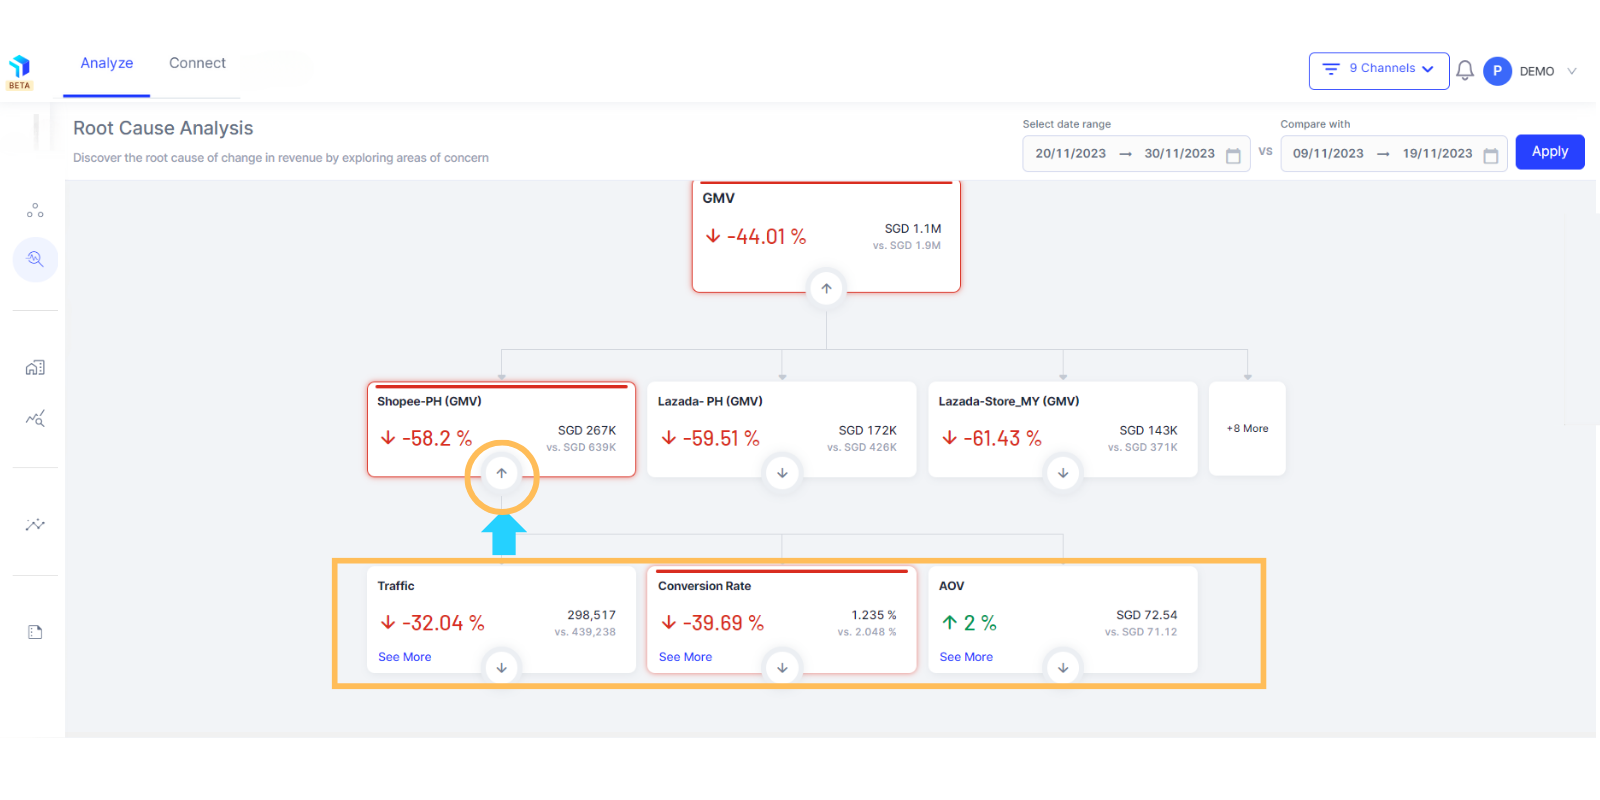
8. You can further drill down into these three key metrics in the eCommerce equation to understand their impact in greater detail:
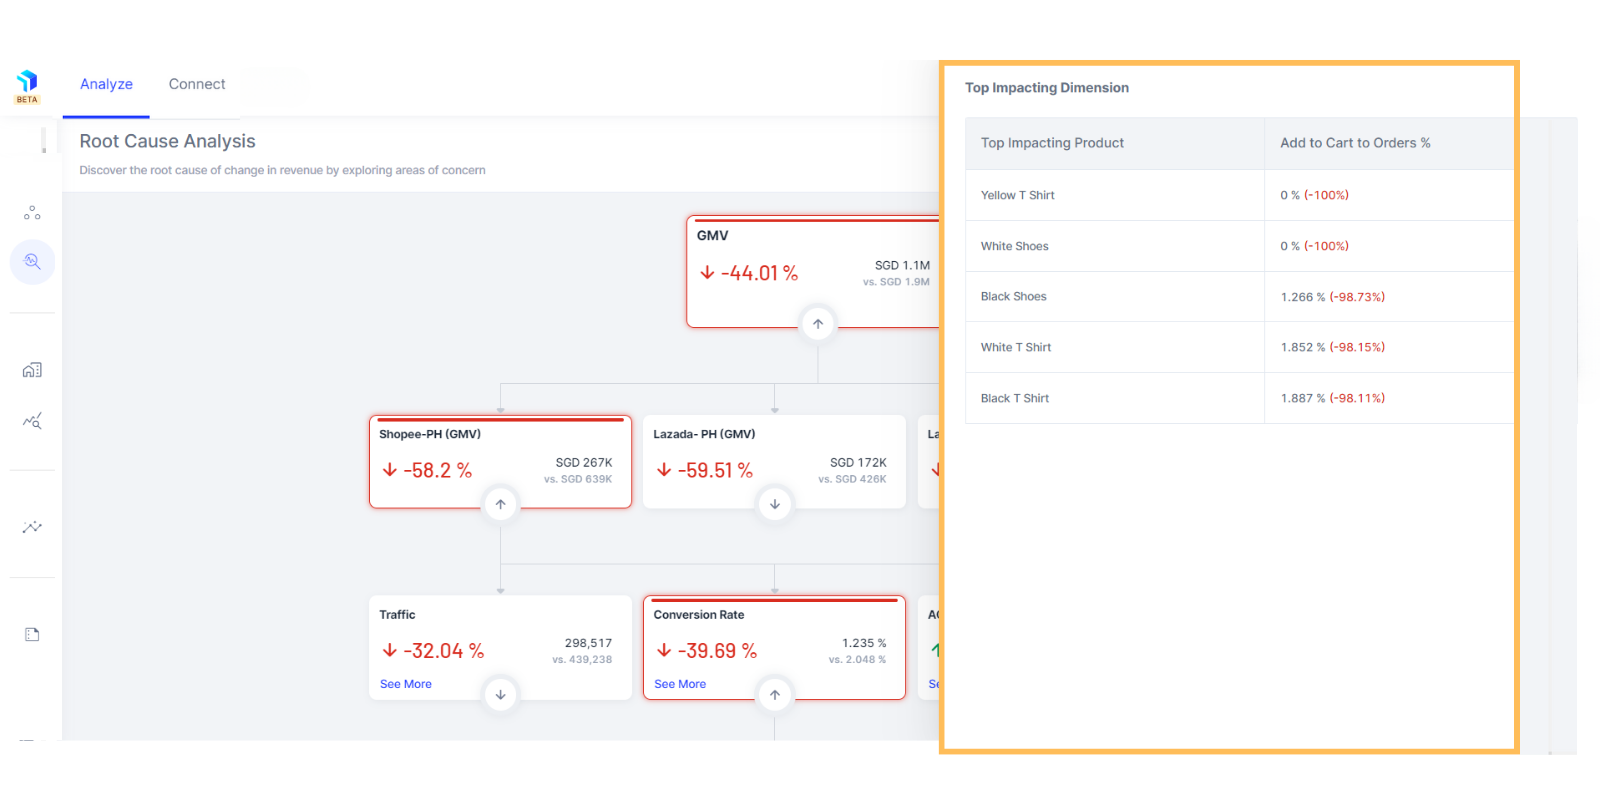
- Traffic: You can see the two key metrics that impacted Traffic and keep drilling further down into sub-metrics to get to last of node that indicates the Top Impacting Dimensions. Click on the See More arrow to view the Top Products or Campaigns that have led to the drop in the metric value.
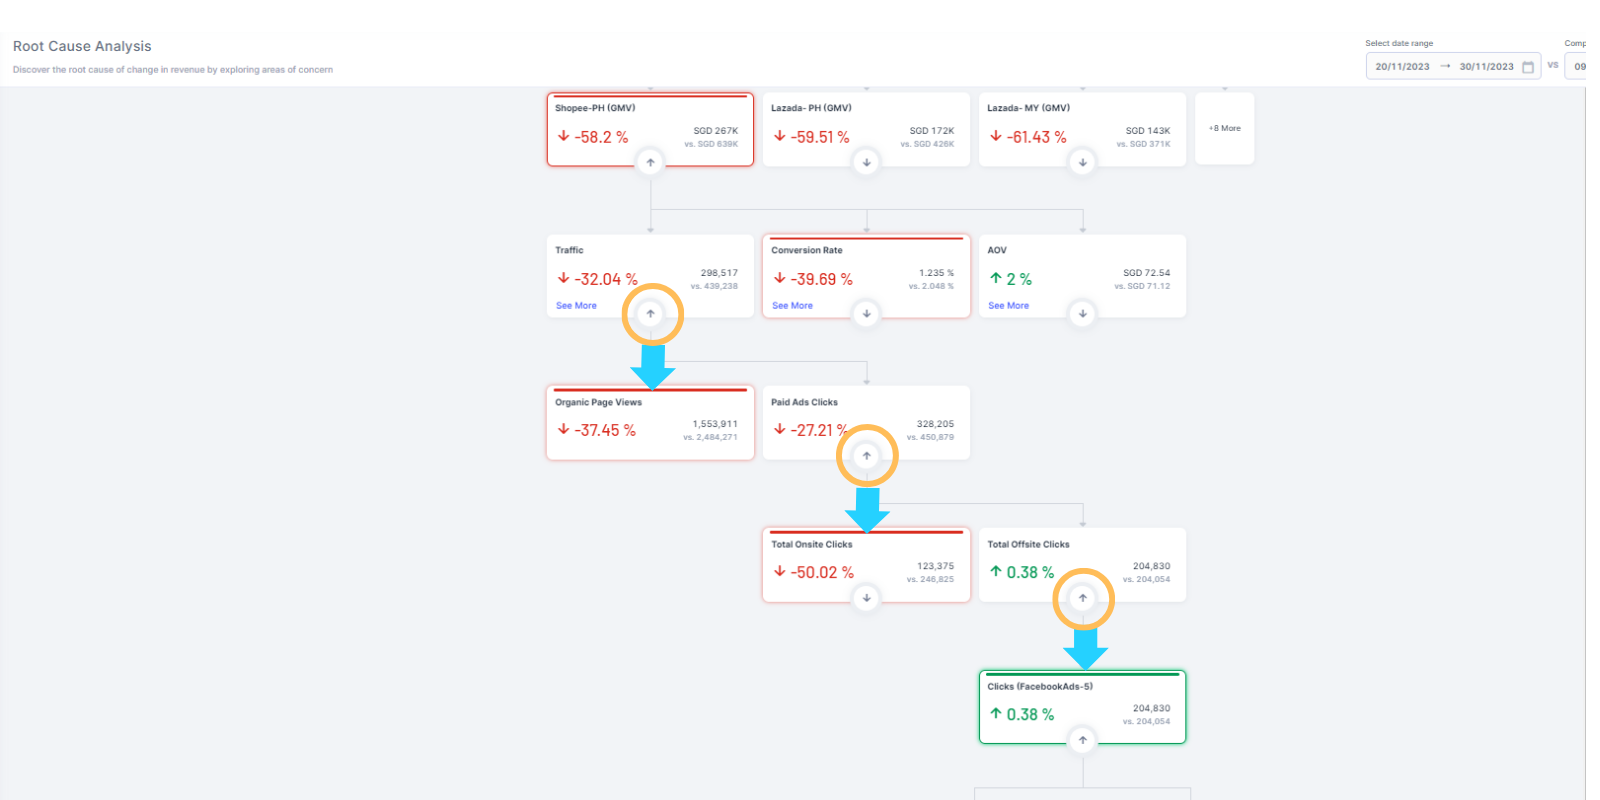
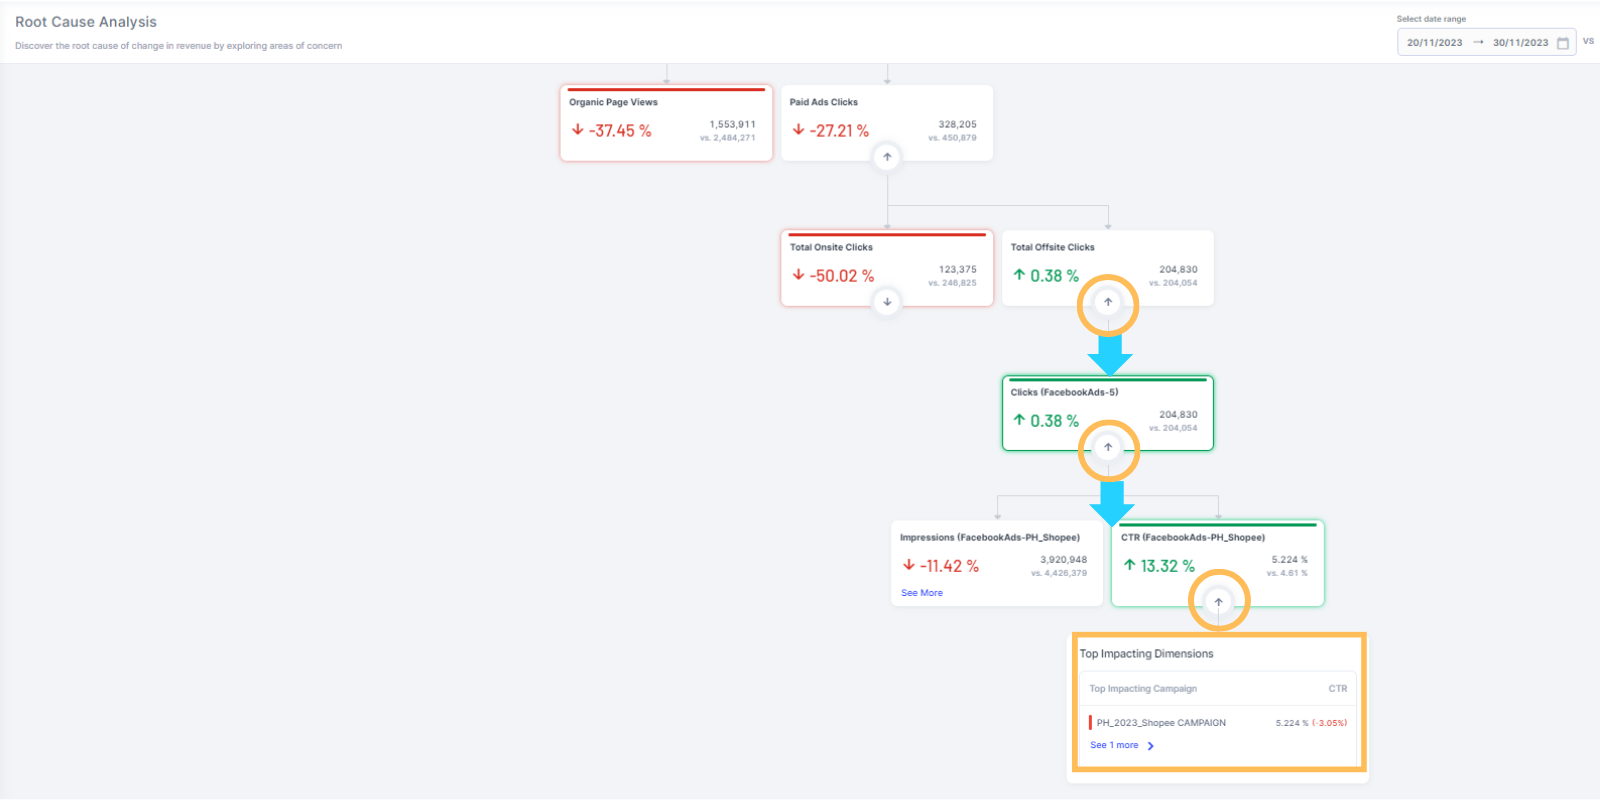
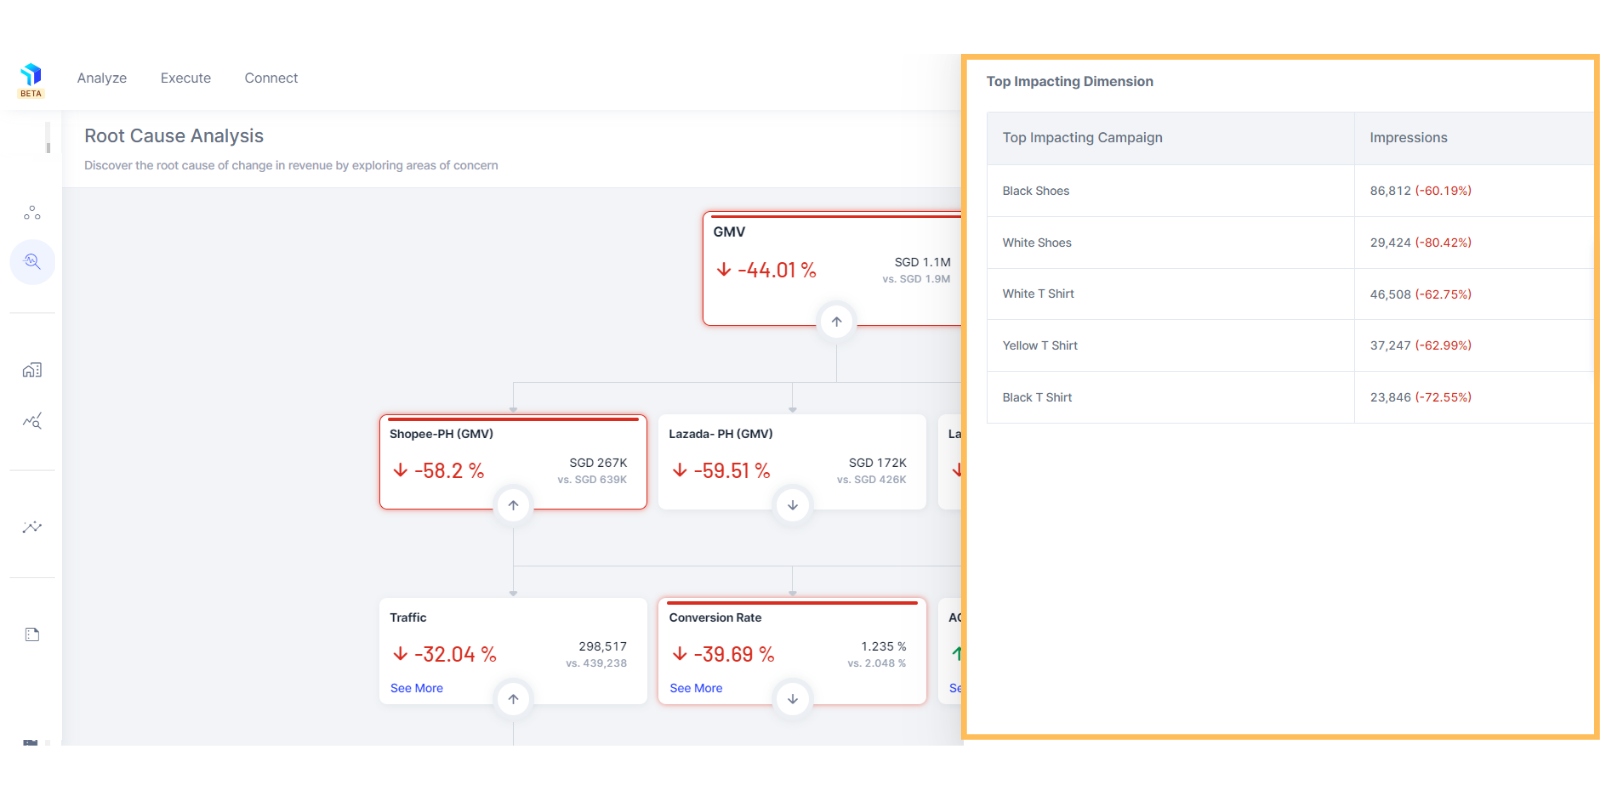
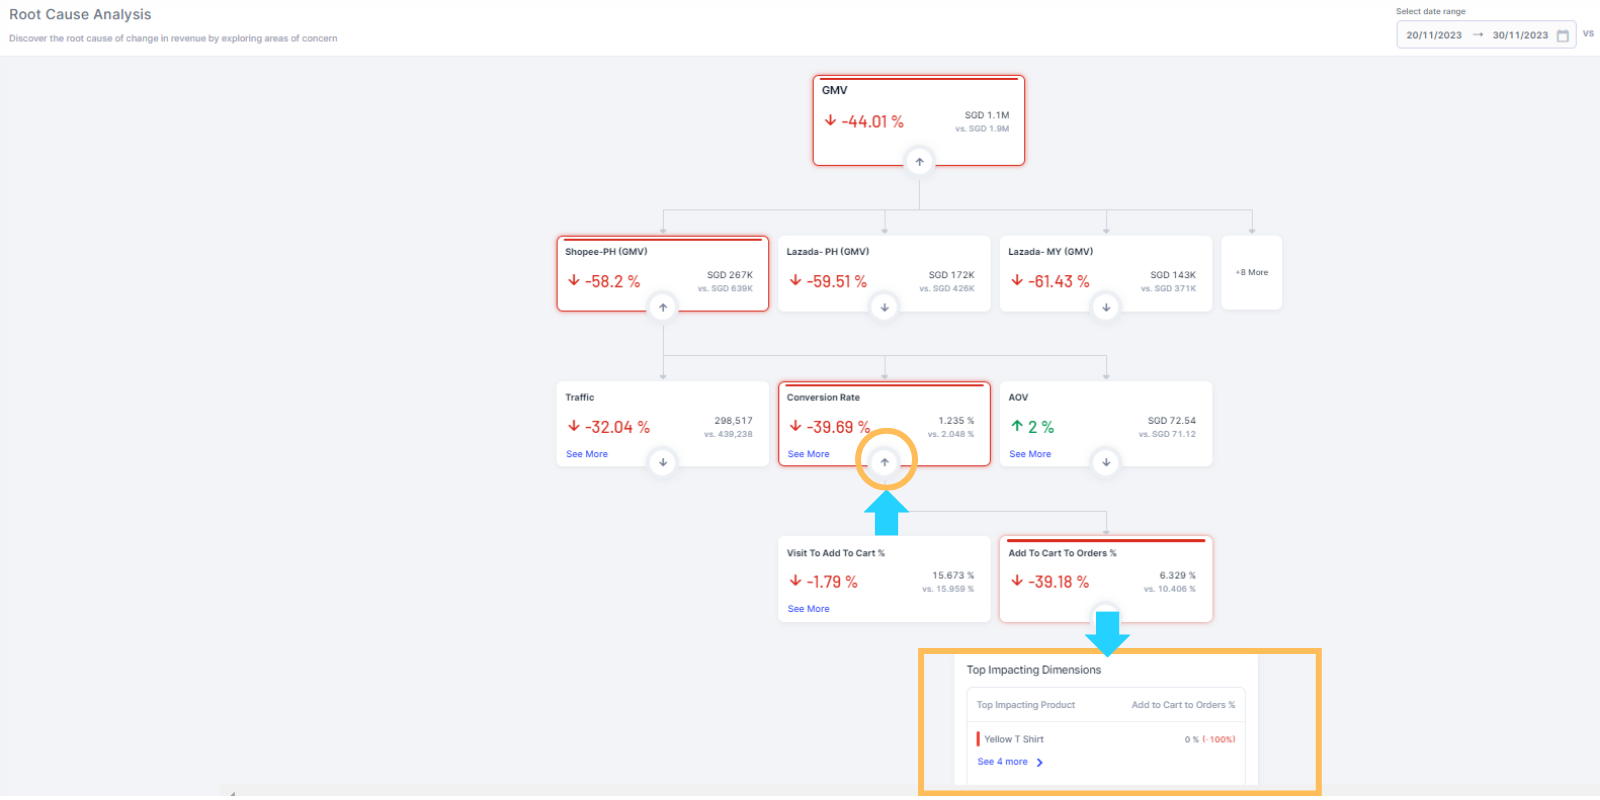
- Conversion Rate: In the current example, this metric has had the maximum impact on GMV. You can keep clicking and clicking on impacting sub-metrics like Visit To Add To Cart & Add To Cart To Orders to get to the Top Impacting Dimensions. Again, click on See More to land on the Top Products or Campaigns that have led to the drop in the metric value.
- AOV: You can track back to your previous level of dependencies and drill down into AOV to understand how that performed and eventually get to Top Impacting Dimensions to see the Top Products or Campaigns that have led to the drop in the metric value.
Note: To see the Traffic and Conversion Rate data, ensure you have installed the Chrome Extension.
Related Article(s):
Workspace Overview
Install Chrome Extension
Marketing Deep Dive Overview
Business Deep Dive Overview
Integrate Your eCommerce Data Sources
