Product Deep Dive : Product Performance
Product Performance dashboard provides a crystal-clear view of how individual products are performing. This dashboard has two vital sections: ABC Analysis and Product Overview.
Steps to access Product Performance
Analyze > Deep Dive > Product > Product Performance
ABC Analysis
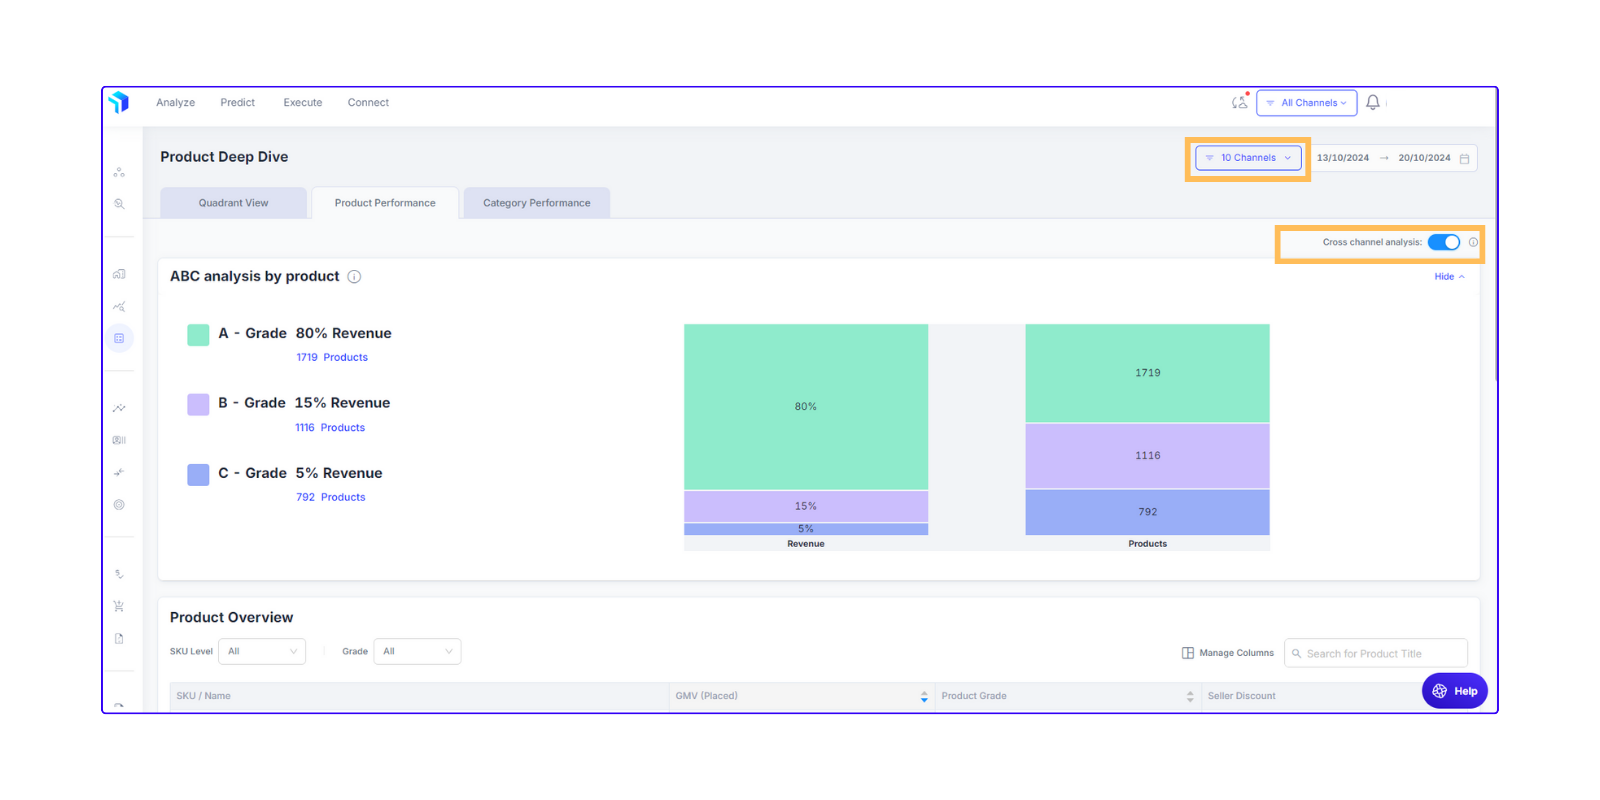
ABC analysis categorizes products based on the revenue they generate over chosen time period.
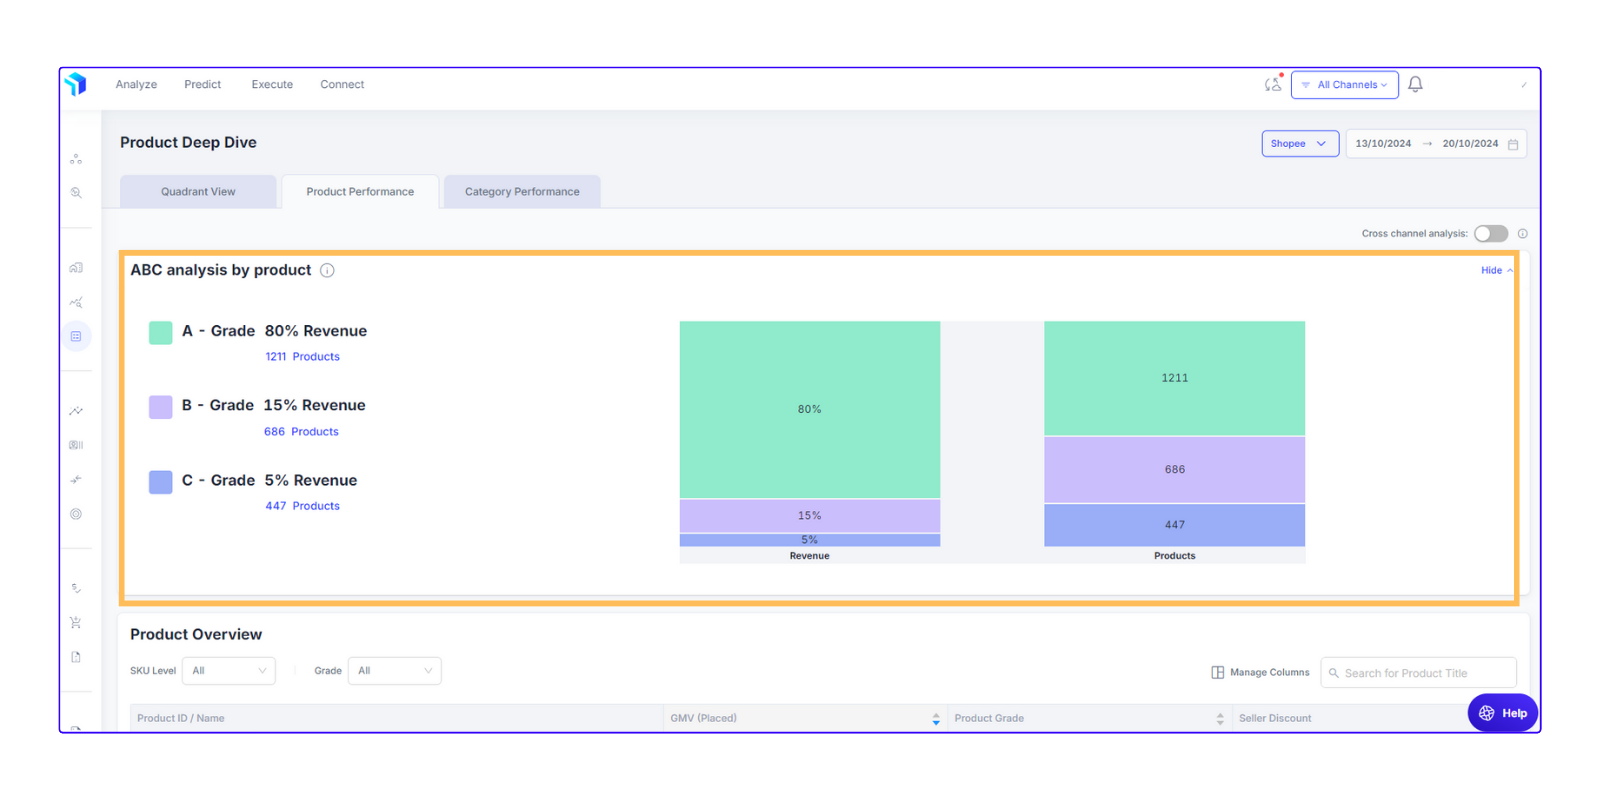
- A-grade products: A-grade products are the backbone of your revenue, making up the top 80%. These items are best sellers and require constant optimization to maintain their high performance.
- B-grade products: B-grade products represent the middle tier, contributing about 15% of your revenue. This segment holds potential breakout stars and may need strategic tweaks to their positioning, pricing, or promotion to enhance their sales.
- C-grade products: C-grade products account for the remaining 5% of revenue. These products are underperformers. It's crucial to assess whether to revamp them or phase them out from the catalog.
Product Overview
The Product Overview feature allows you to analyze performance at an even more granular level - across Parent, Child, or Parent-Child variations.
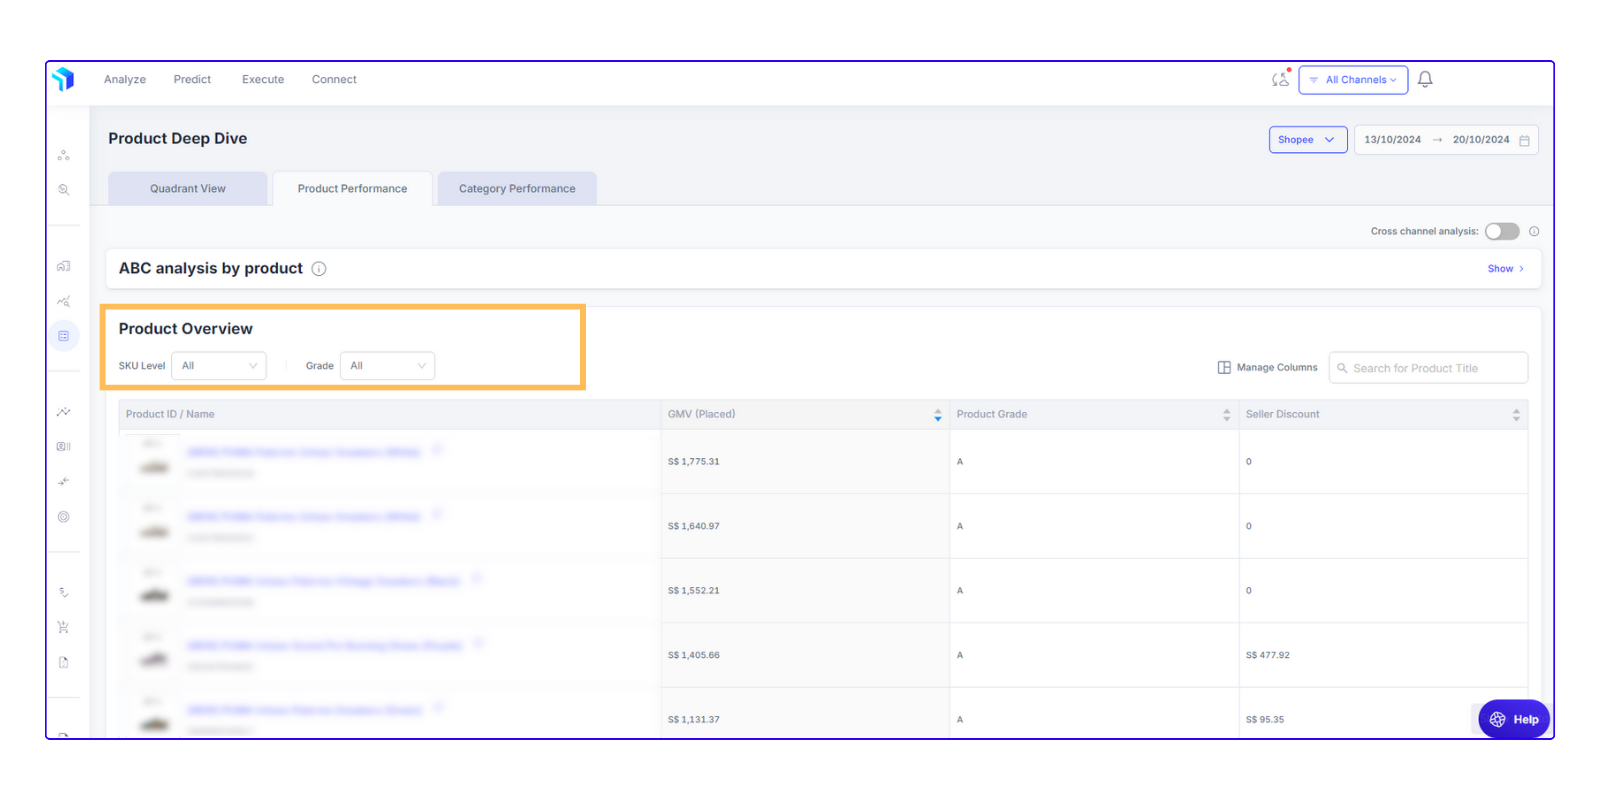
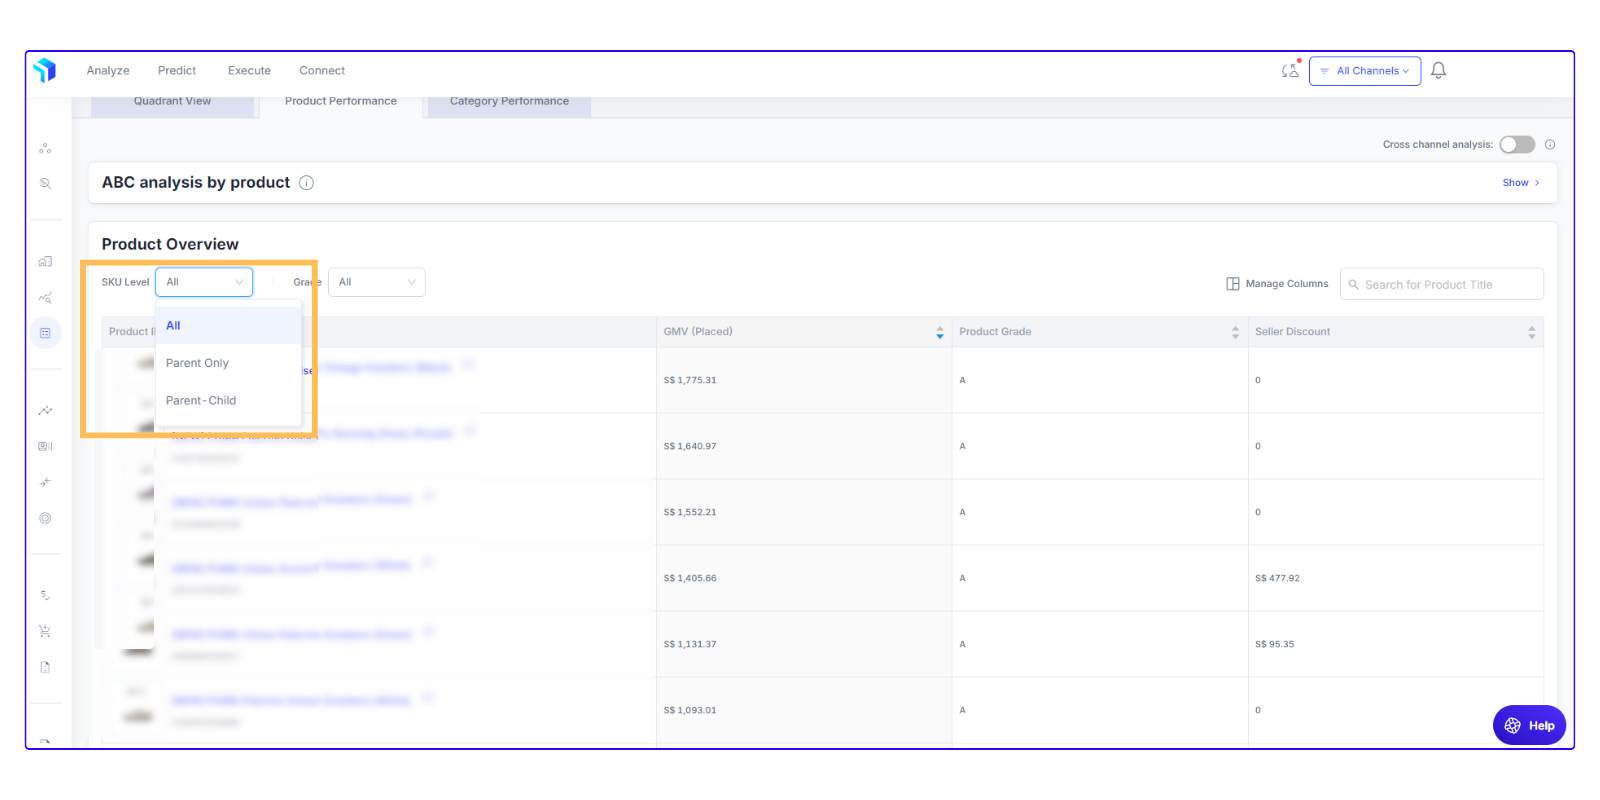
This view includes important metrics such as product page views, add to carts, revenue, advertising spend, and conversions. It gives you a comprehensive understanding of your product lifecycle and buyer journey, pinpointing areas for improvement across the board.
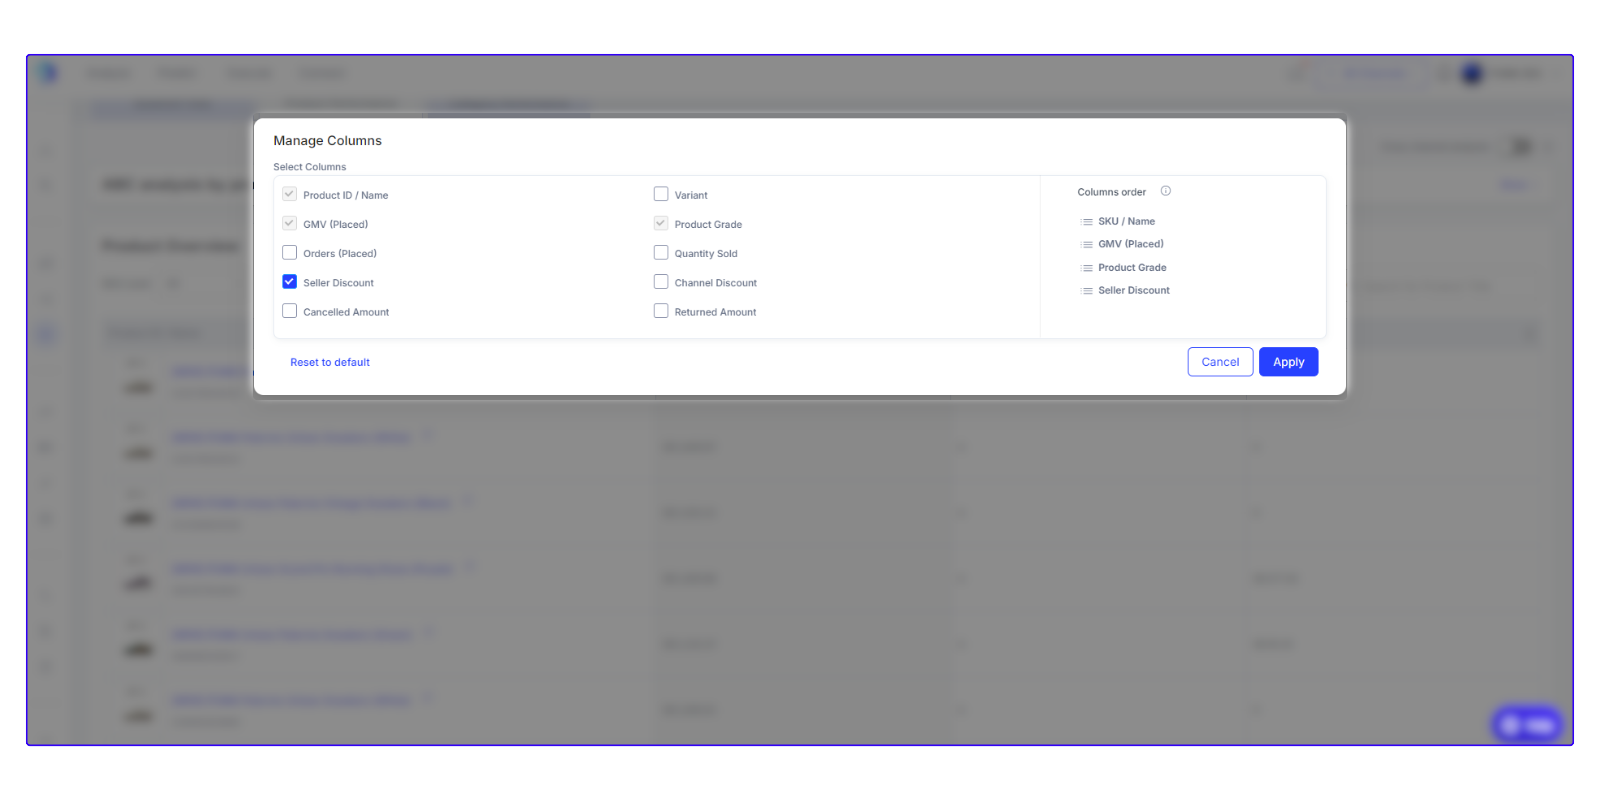
You can also customize what metrics see and the date range by selecting from available columns:
- GMV (Gross Merchandise Value) Place
- Product Grade
- Orders Placed
- Quantity Sold
- Seller Discount
- Channel Discount
- Cancelled Amount
- Returned Amount
- Visitors
- Product Page Views
- Add to Cart Units
- Add to Cart Product Visitors
- Ad Spend
- Ad Revenue
- Conversions, etc
SKU Specific Trend Analysis
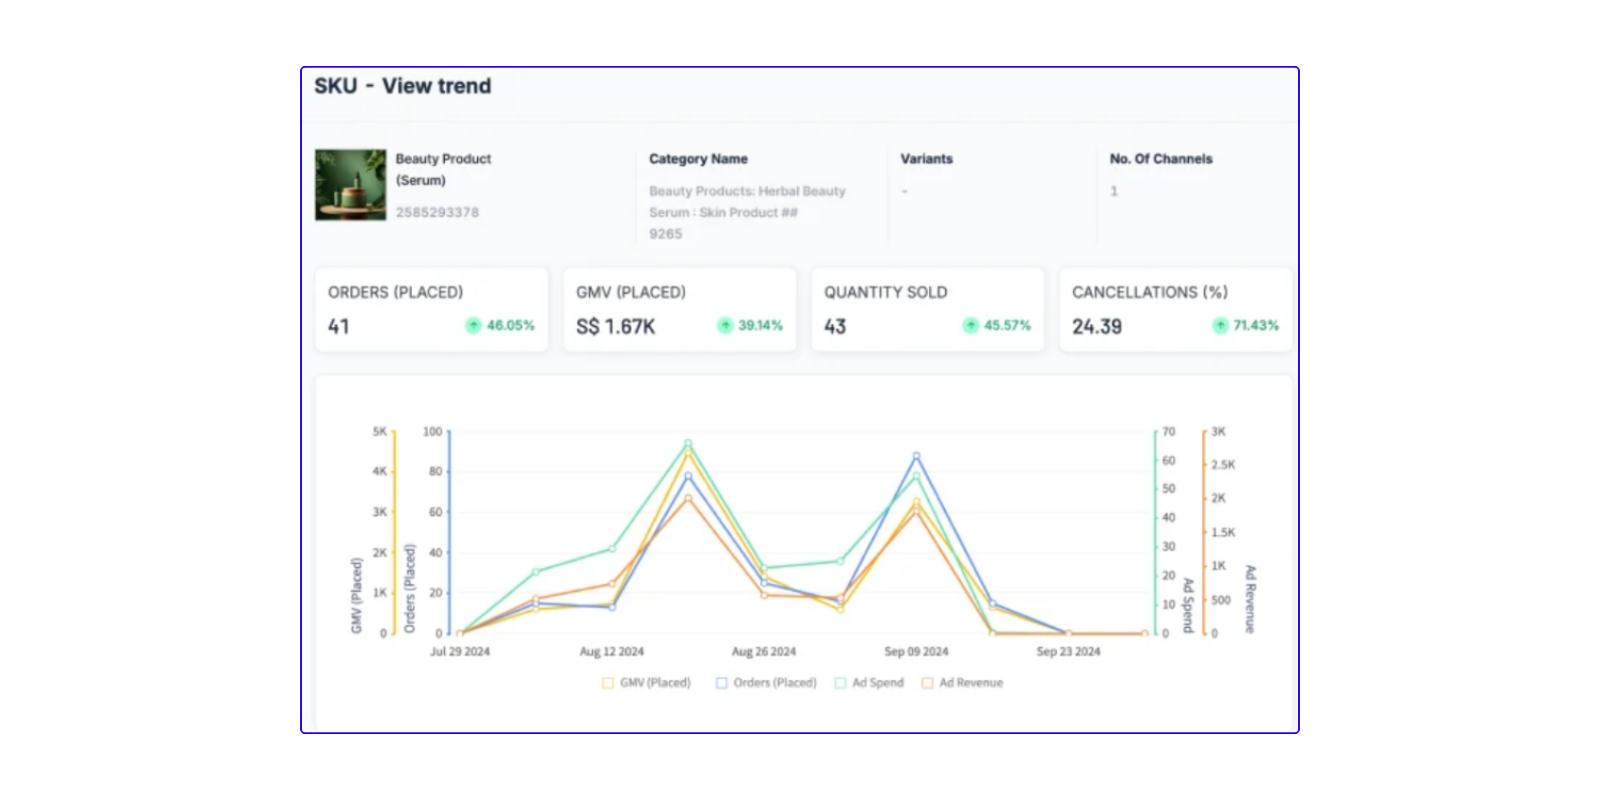
Clicking on an SKU lets you further analyze and track performance trends, offering insights by source/channel, categorized orderly and tailored by product category for the selectable date range. It gives a trend chart comparing GMV versus orders.
Related Article(s):
Product Deep Dive Overview
Quadrant View

