
Product Deep Dive : Category Performance
The Category Performance dashboard within the Product Deep Dive tool gives a view of how each product category contributes to overall sales. It highlights top-performing categories while identifying areas that need improvement. By tracking key metrics like traffic, quantity sold, and GMV, businesses can uncover sales trends, optimize product offerings, and identify opportunities for growth.
For example, a fashion brand may notice that Footwear is generating higher sales than Accessories. By reviewing category-level performance, they can adjust marketing efforts or expand product offerings in weaker categories to drive better results.
To get a complete understanding of category-level performance, It lets you track both marketplace categories and custom categories unique to your business. You can get a complete understanding of category-level performance and provide data-driven insights necessary to optimize your product offerings.
Steps to access Product Performance
Analyze > Deep Dive > Product > Category Performance
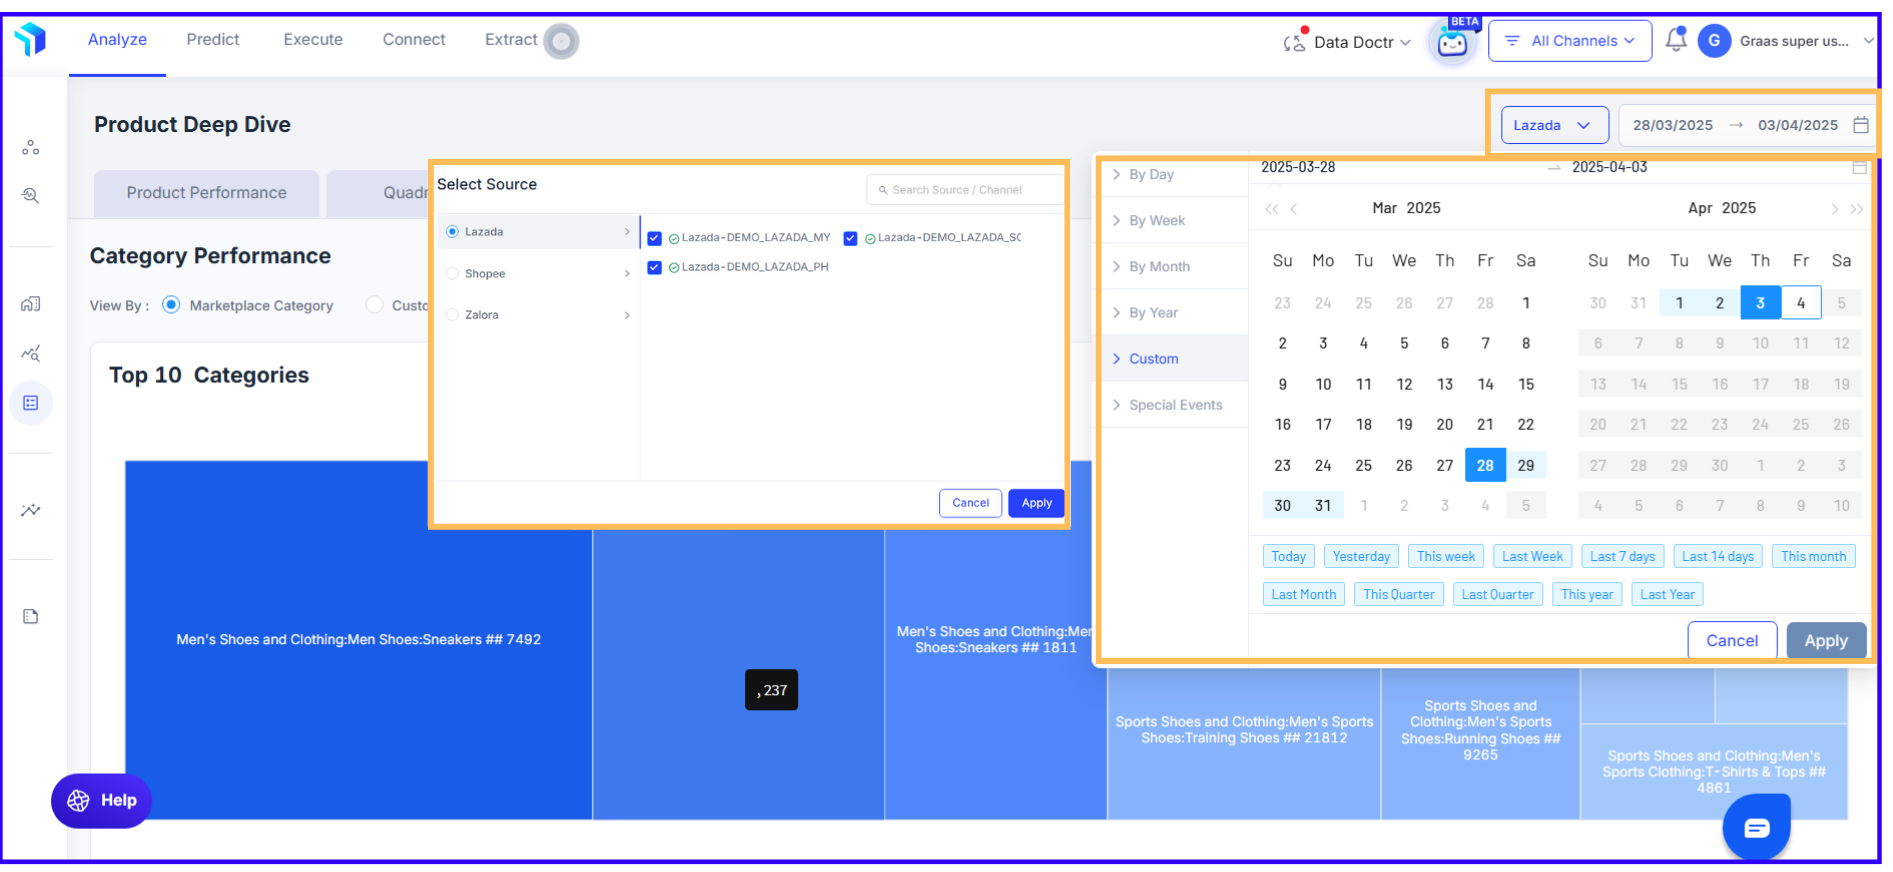
1. Apply Filters for Targeted Analysis
Use the filters at the top left to select a date range or specific sales channels.
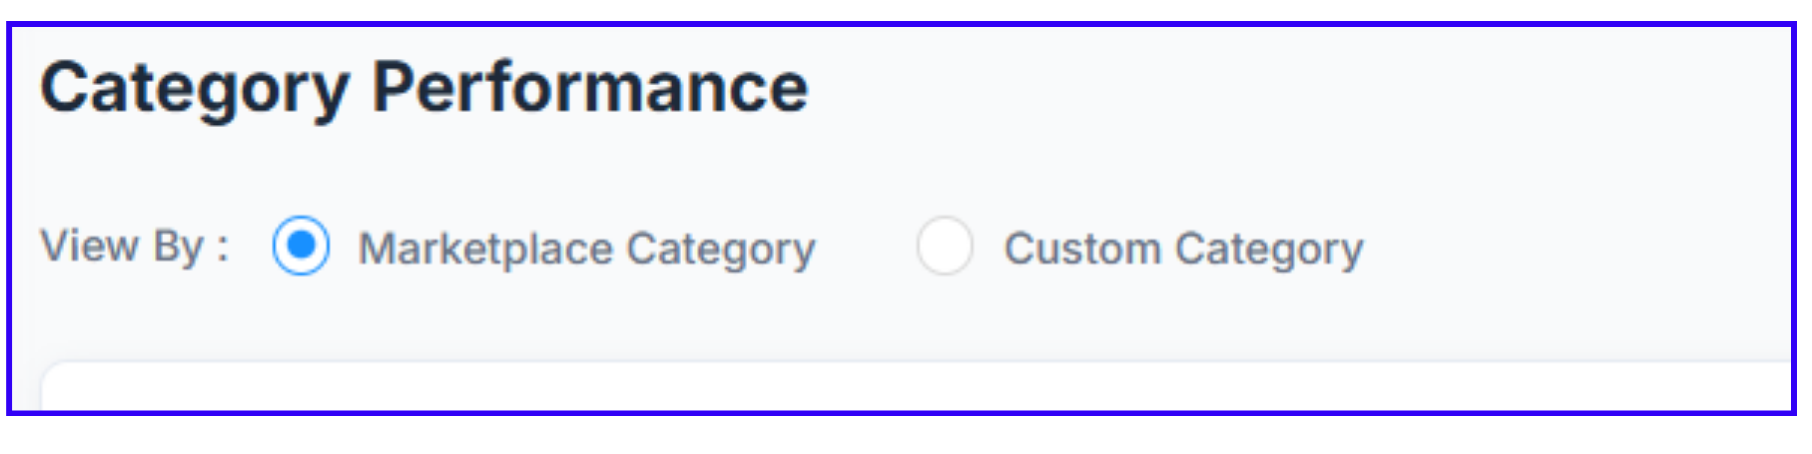
2. Choose How You Want to View Data
- Marketplace Category: View category insights as per marketplace-defined segments.
- Custom Category: Define your own category structure based on internal classifications.
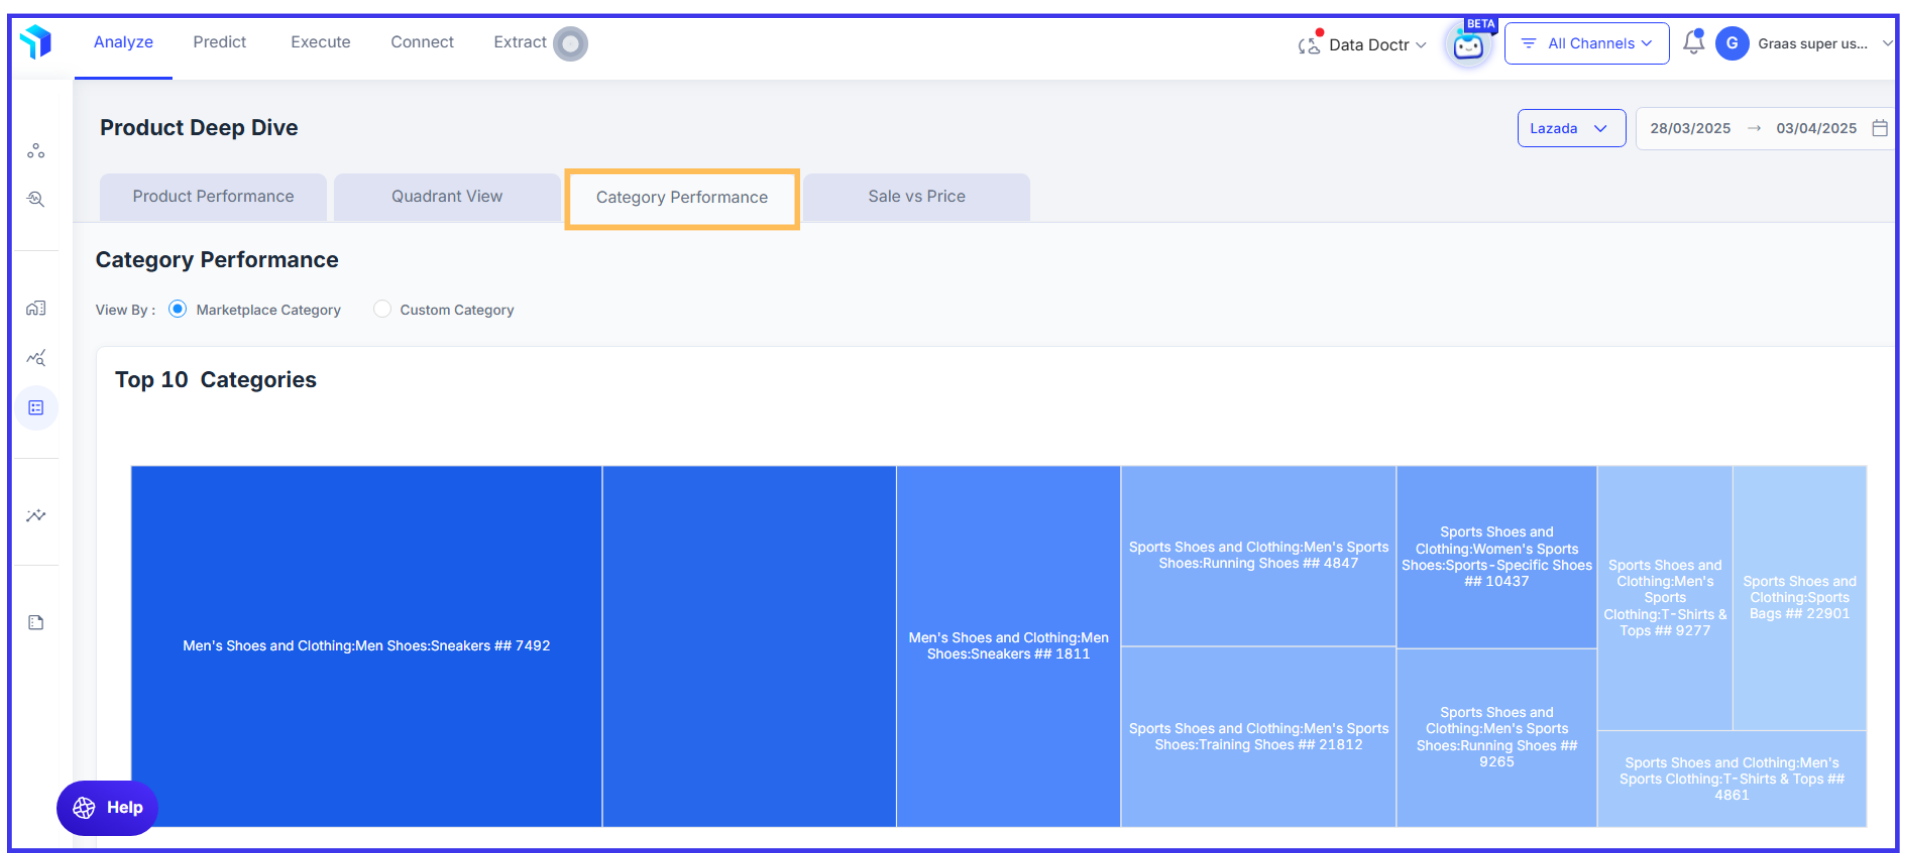
3. Analyze the Top Categories Chart

- The dashboard displays a tree map (heatmap) visualization of the Top 10 Categories based on order volume or GMV.
- Dark blue categories indicate strong performance, while lighter shades highlight those needing improvement.
- Identify which categories generate the most revenue and which have potential for growth.
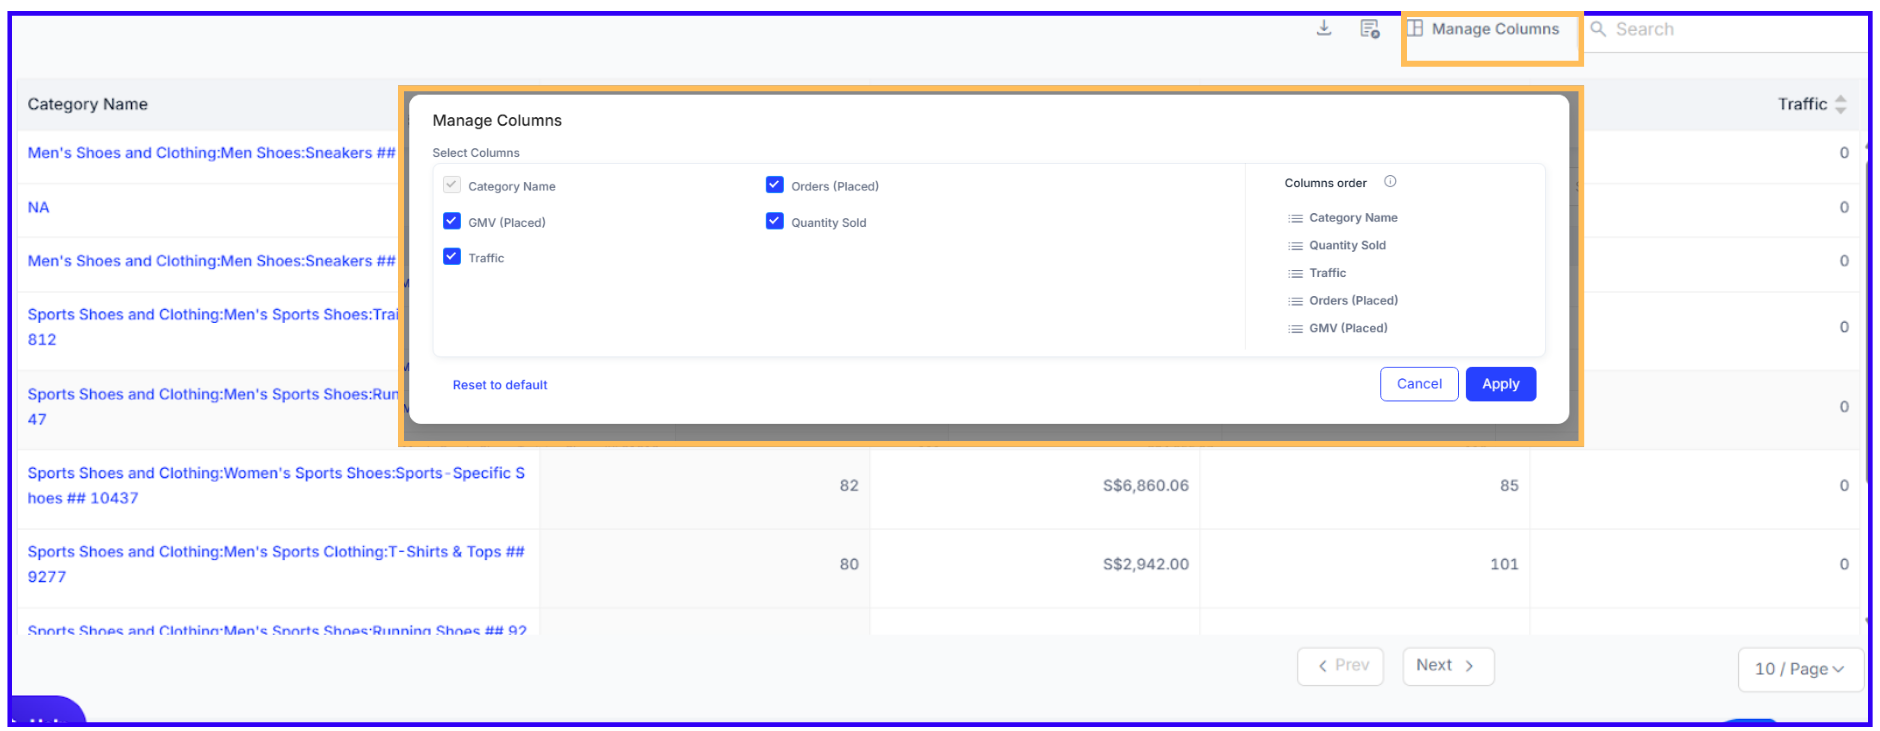
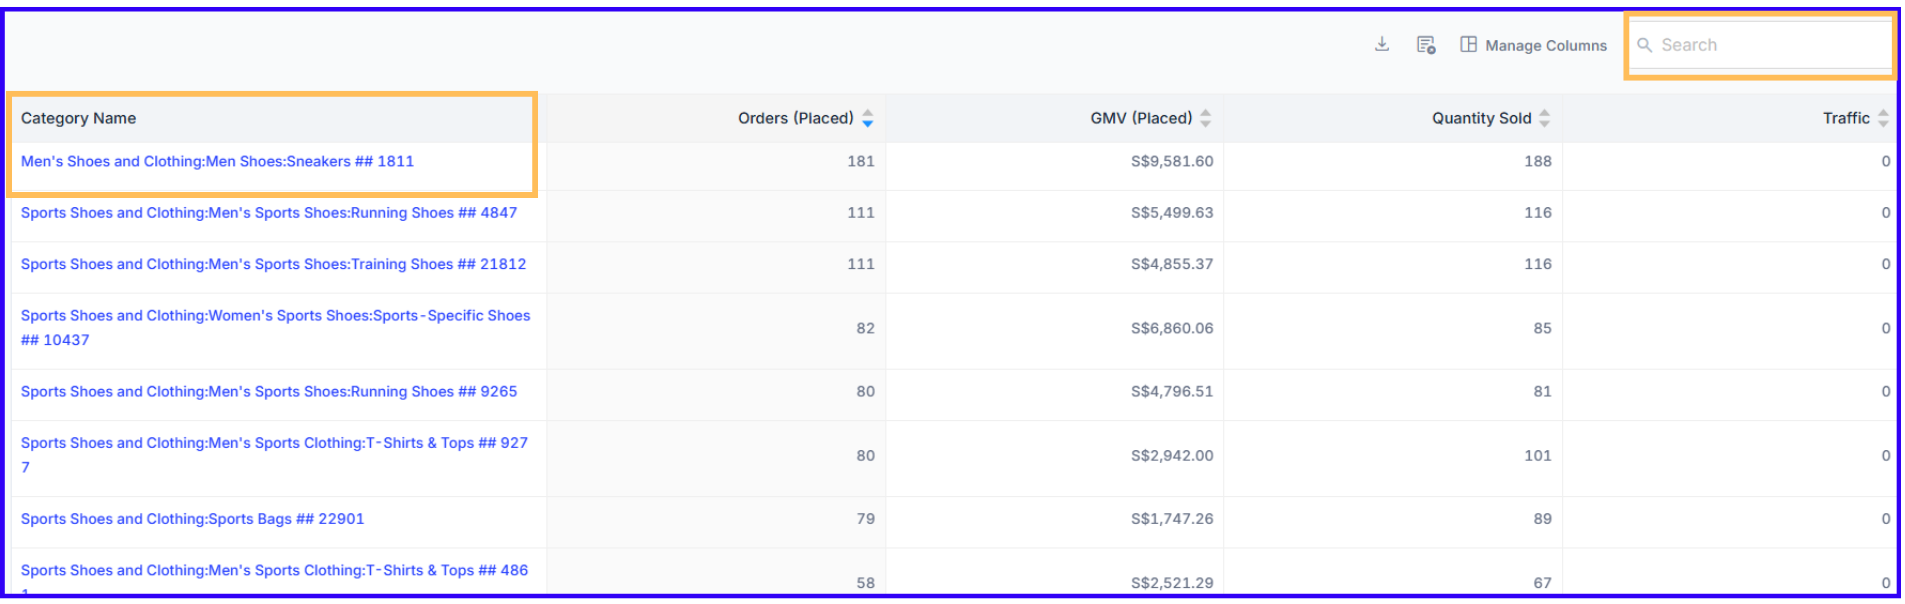
3. Review Key Performance Metrics
The dashboard provides insights into four key metrics:
✅ Orders – Number of purchases in each category.
✅ GMV – Revenue generated by each category.
✅ Quantity Sold – Total number of units sold per category.
✅ Traffic – Number of visitors viewing products in that category.
-Click Manage Column to customize the displayed metrics.
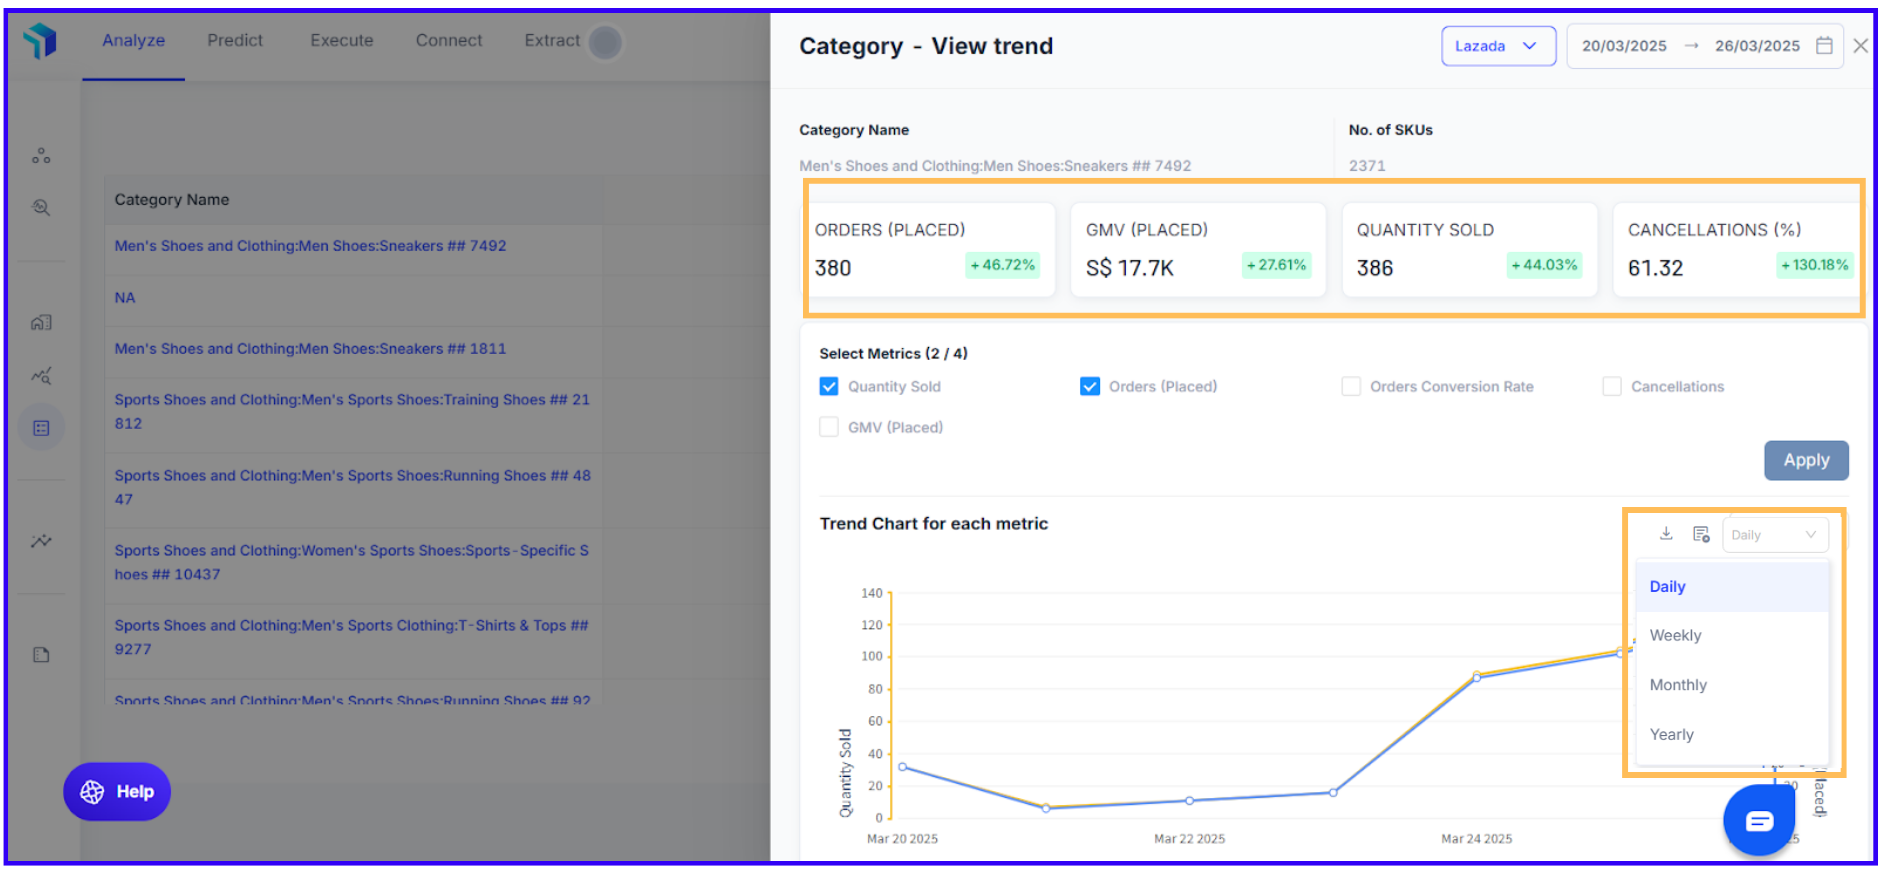
5. Explore Category Trends in Detail
- Click on a category name to view a detailed trend analysis.
- The Monitor trends in Orders, Quantity Sold, GMV, Cancellations, and Conversion Rate.
- Adjust the timeline view to analyze performance daily, weekly, monthly, or yearly.
- Compare past trends to identify seasonal patterns and long-term shifts.
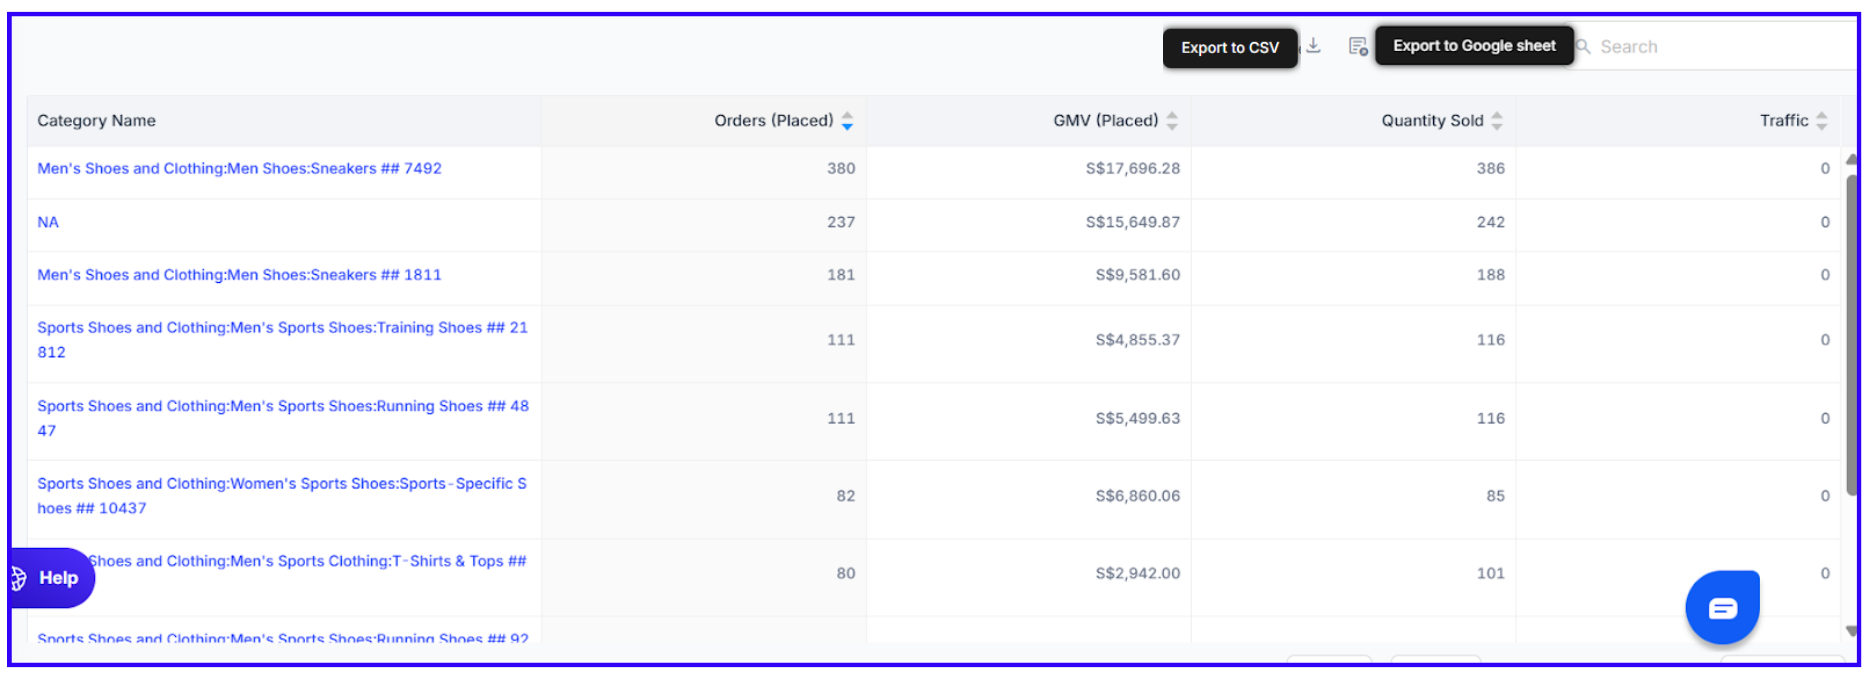
6. Download and Export Category Data
- Click the download icon (downward arrow) or sheets icon to export data in CSV format or Google Sheets.
Take Action Based on Category Performance Insights
- Expand top-performing categories by adding new SKUs or increasing marketing efforts.
- Improve weaker categories by adjusting pricing, promotions, or visibility.
- Determine where to allocate marketing spend for the best returns.
- Decide which underperforming SKUs should be discontinued or optimized.
By using the Category Performance dashboard effectively, businesses can make data-driven decisions, refine category strategies, and drive overall sales growth.
Related Article(s):
Product Deep Dive Overview
Quadrant View