Product Deep Dive Overview
Product Deep Dive helps you effortlessly understand and optimize your product or SKU performance. By providing clear, data-driven insights, it enables businesses to make informed decisions on product strategies, marketing efforts, and inventory management. With intuitive dashboards that highlight key metrics like sales, traffic, and conversions, Product Deep Dive empowers you to pinpoint top performers, identify areas for improvement, and drive growth.
Steps to access Product Deep Dive
Click on Analyze > Deep Dive > Product
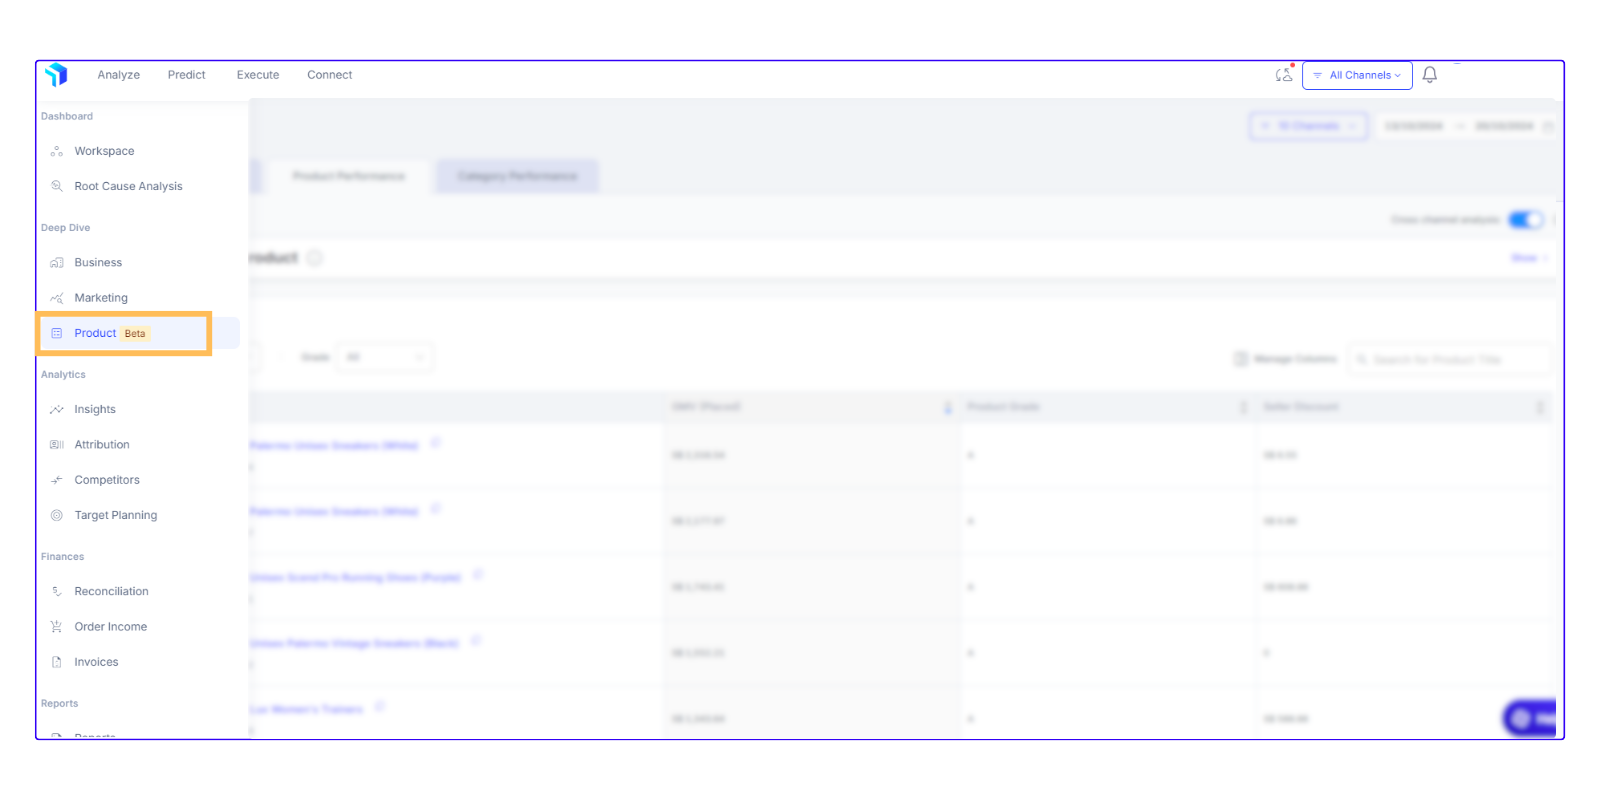
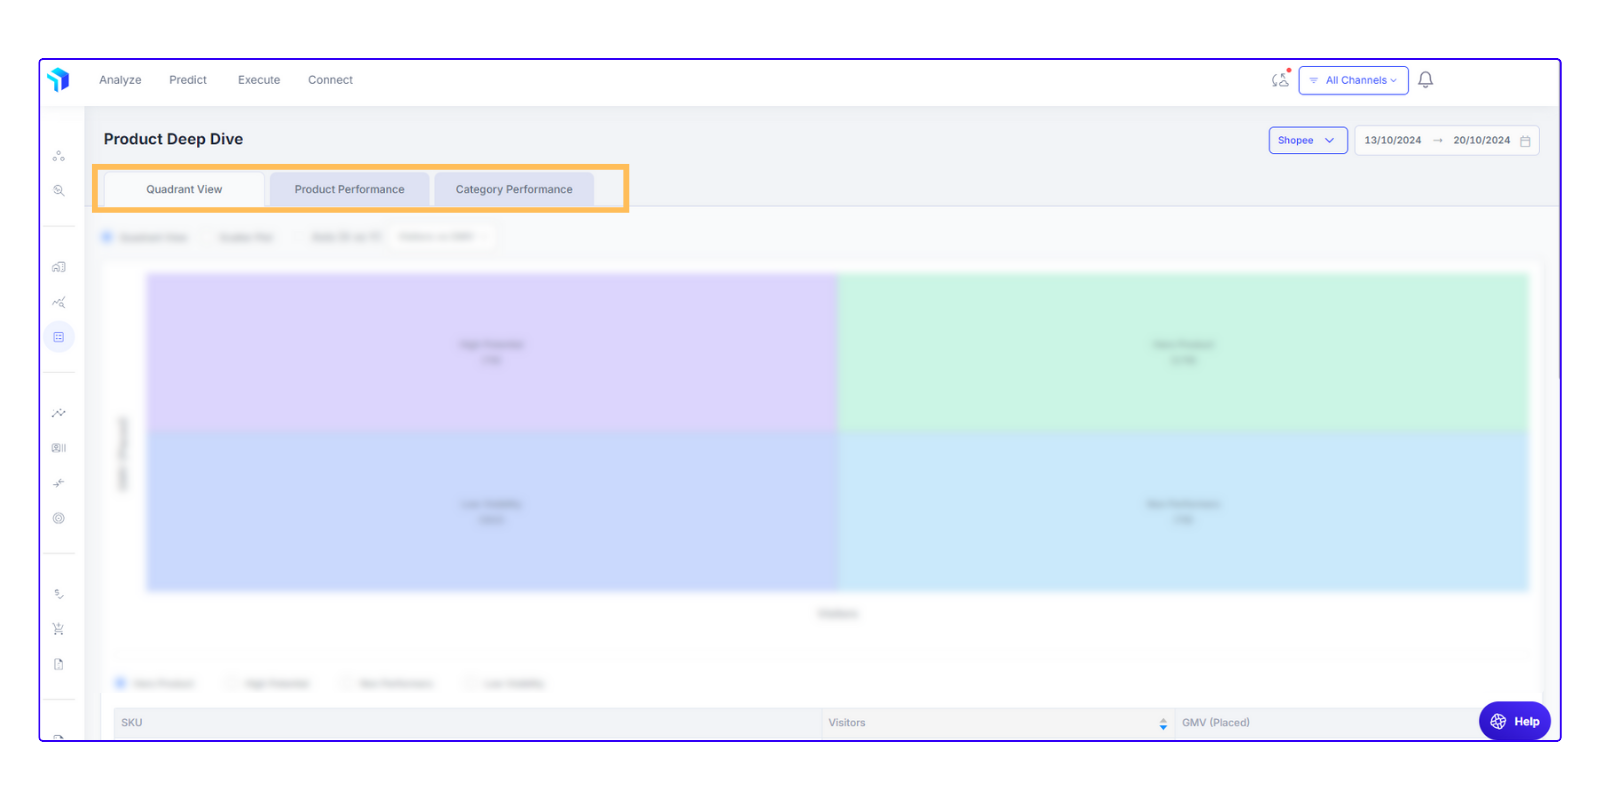
Once there, you will discover three intuitive dashboards:
Quadrant View, Product Performance and Category Performance
Quadrant View
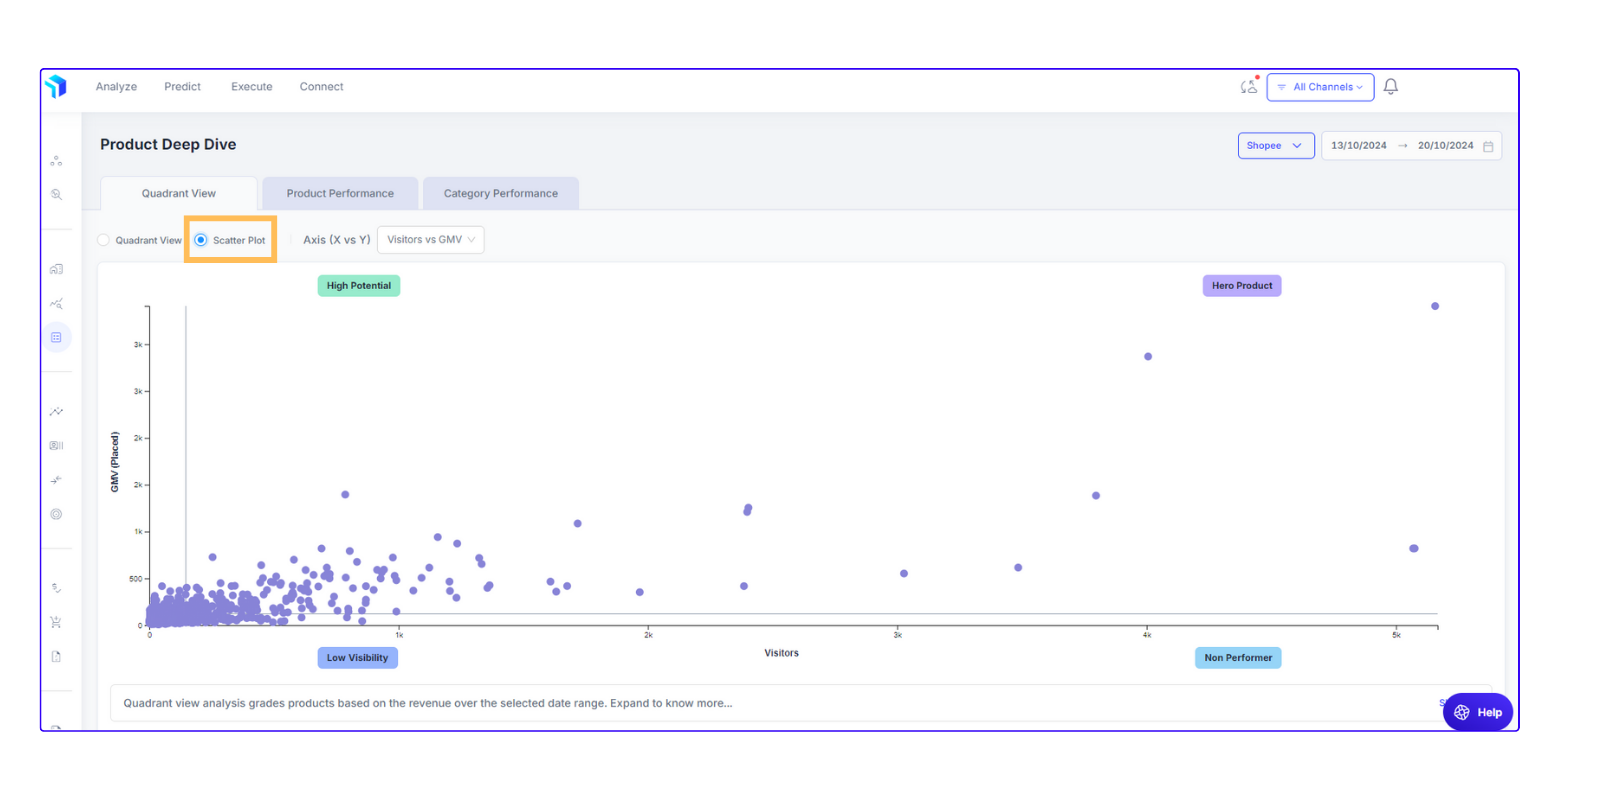
Quadrant View dashboard lays out product / SKU performance based on Visitors versus Gross Merchandise Value (GMV).
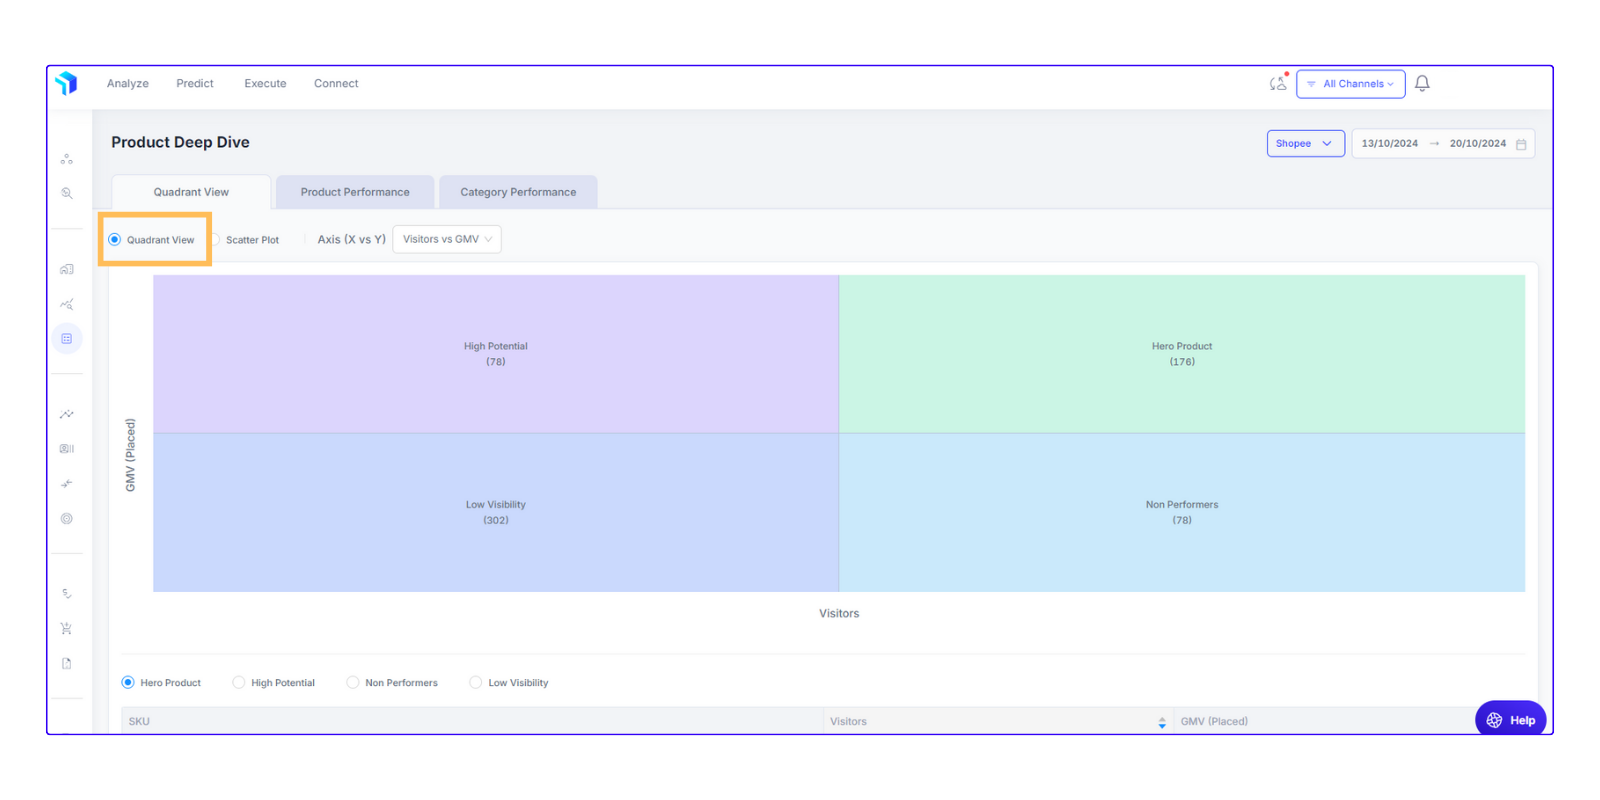
It is designed to help you instantly identify:
- Hero Product: Products that are both popular and generate high revenue.
- High Potential: Products that attract visitors but haven’t translated that interest into similar levels of revenue yet.
- Low Visibility: High-revenue products that aren’t getting the visitor numbers they deserve.
- Non-Performers: Products that are neither attracting significant traffic nor generating substantial revenue.
This quadrant view pinpoints exactly where each SKU stands, enabling you to make informed decisions about product strategy, marketing, and inventory management by giving straightforward, actionable insights into product performance.
In addition to this clear categorization, Quadrant View includes a scatter plot, providing a visual representation of how each SKU compares in terms of traffic and GMV. This plot enables quick identification of outliers and trends, ensuring you can act swiftly to adjust strategies.
Product Performance
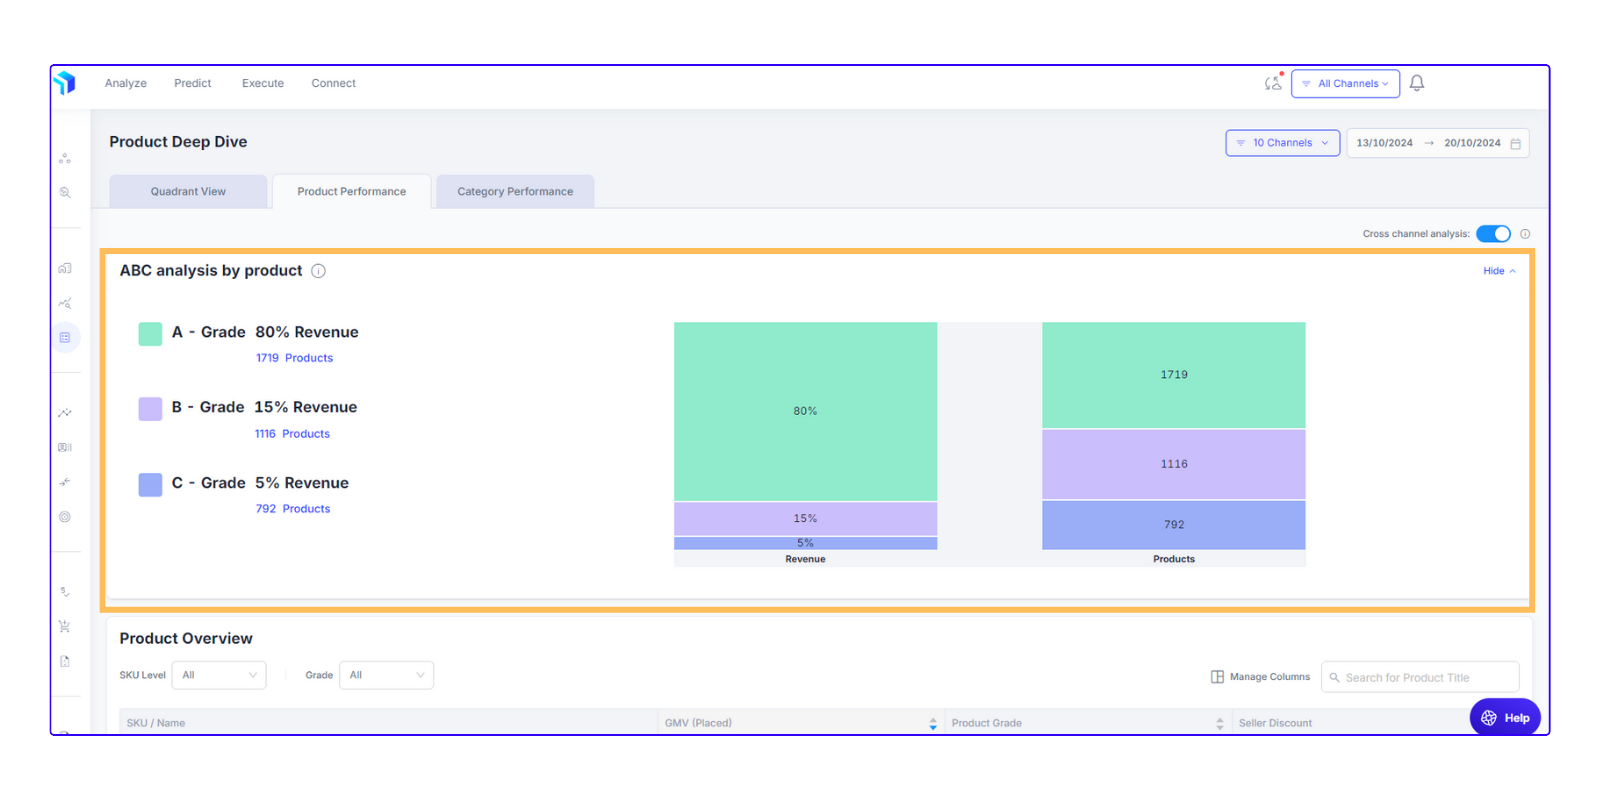
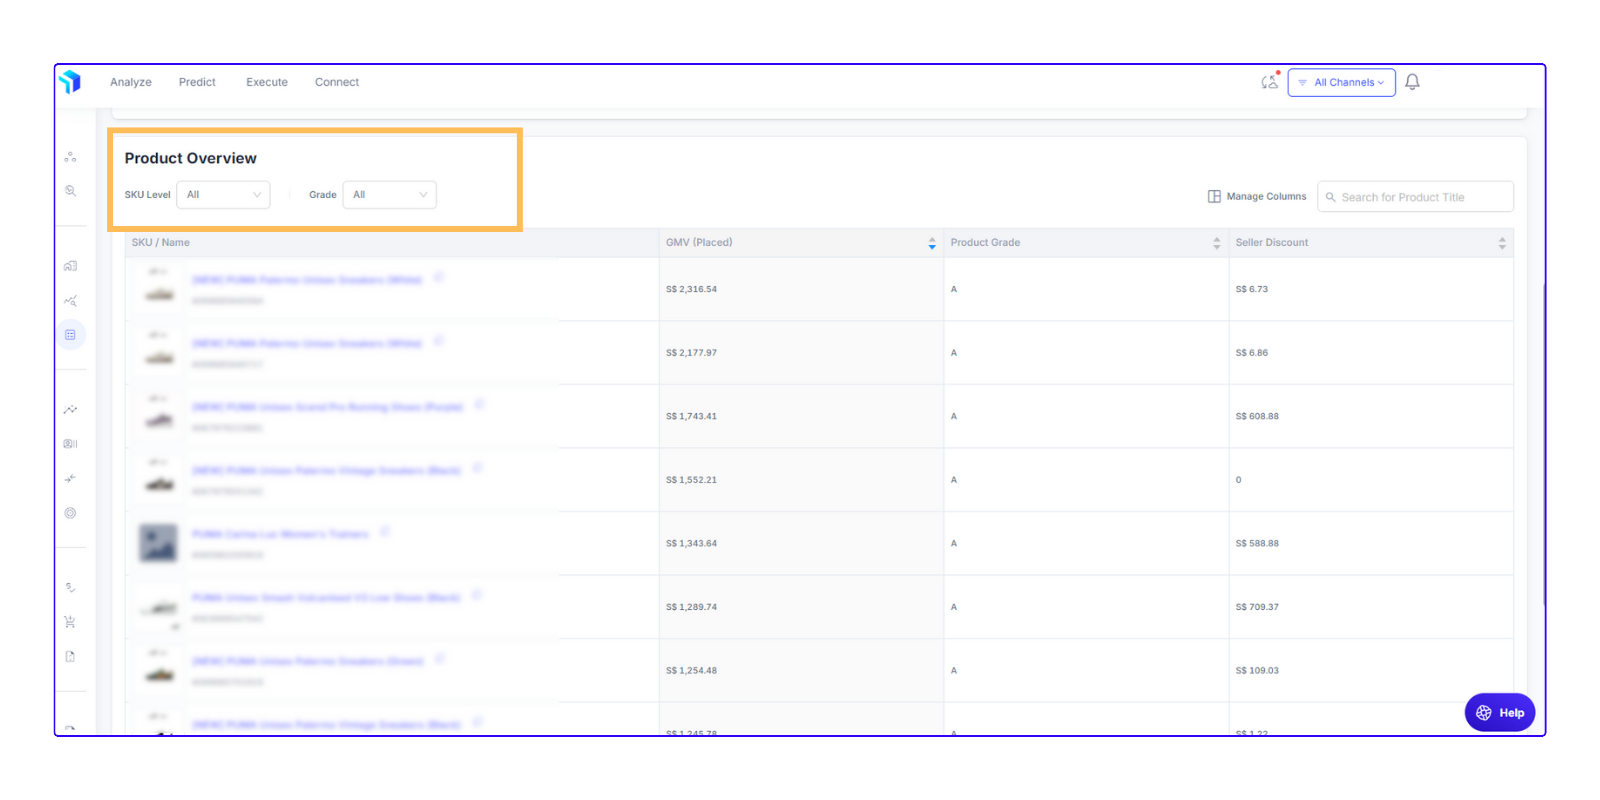
Product Performance dashboard provides a crystal-clear view of how your products or SKUs are performing. This dashboard has two vital sections: ABC Analysis and Product Overview.
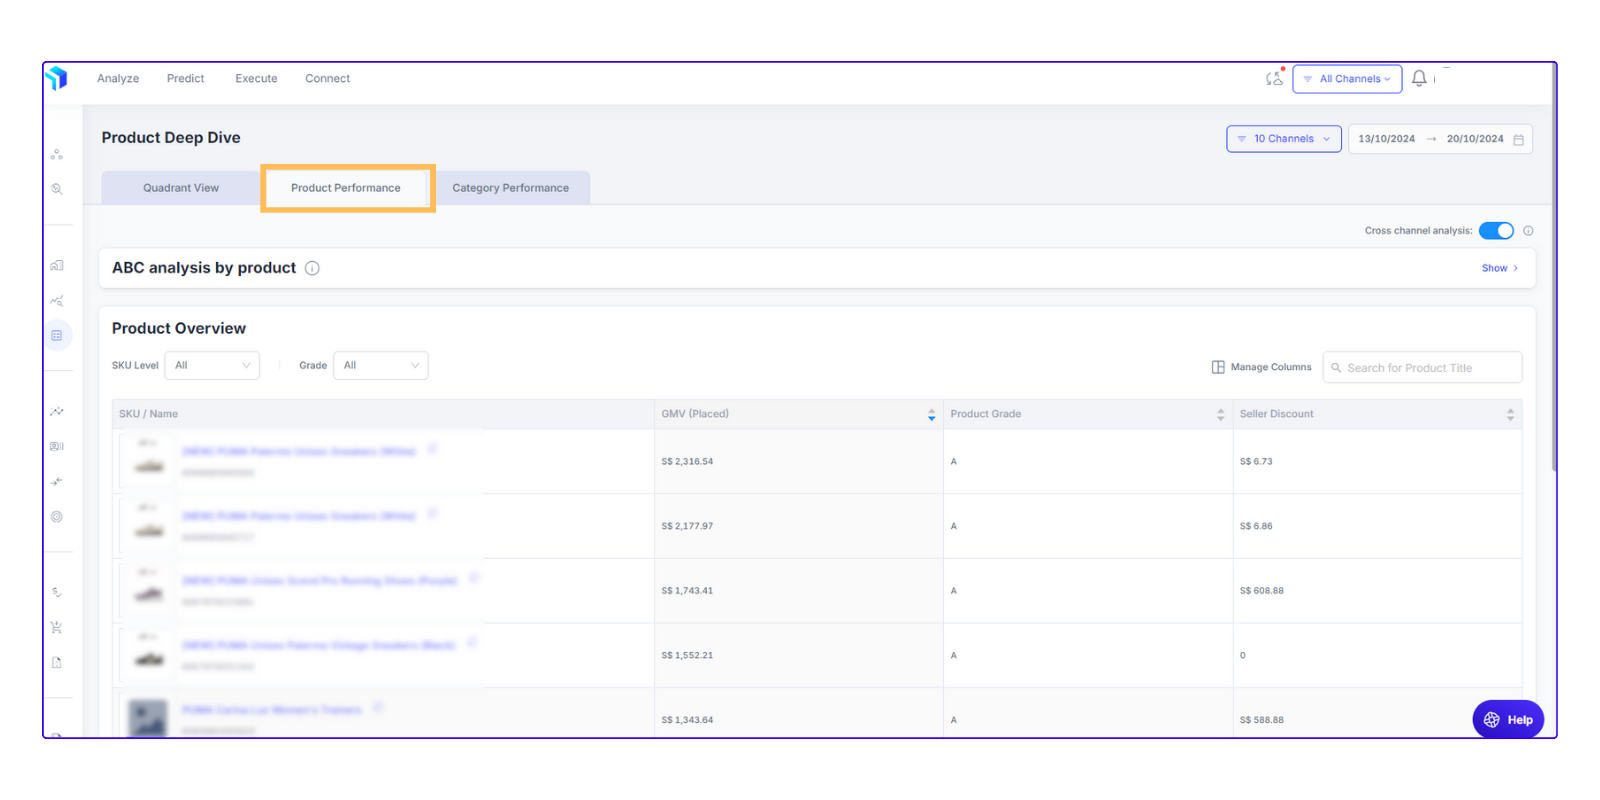
- ABC Analysis: This segment classifies products into three categories based on revenue generated over the selected date range.
- A-grade products constitute the top 80% of revenue. These products are star performers.
- B-grade products contribute 15% to revenue. These products may require strategic adjustments.
- C-grade products represent the final 5% of revenue, highlighting products that might need reassessment or discontinuation.
- Product Overview: Dive deeper at an SKU level across Parent, Child, or Parent-Child variations. This comprehensive view spans everything from product page views, adds to carts, revenue, ad spends, to conversions, offering a 360-degree perspective of product lifecycle.
Category Performance
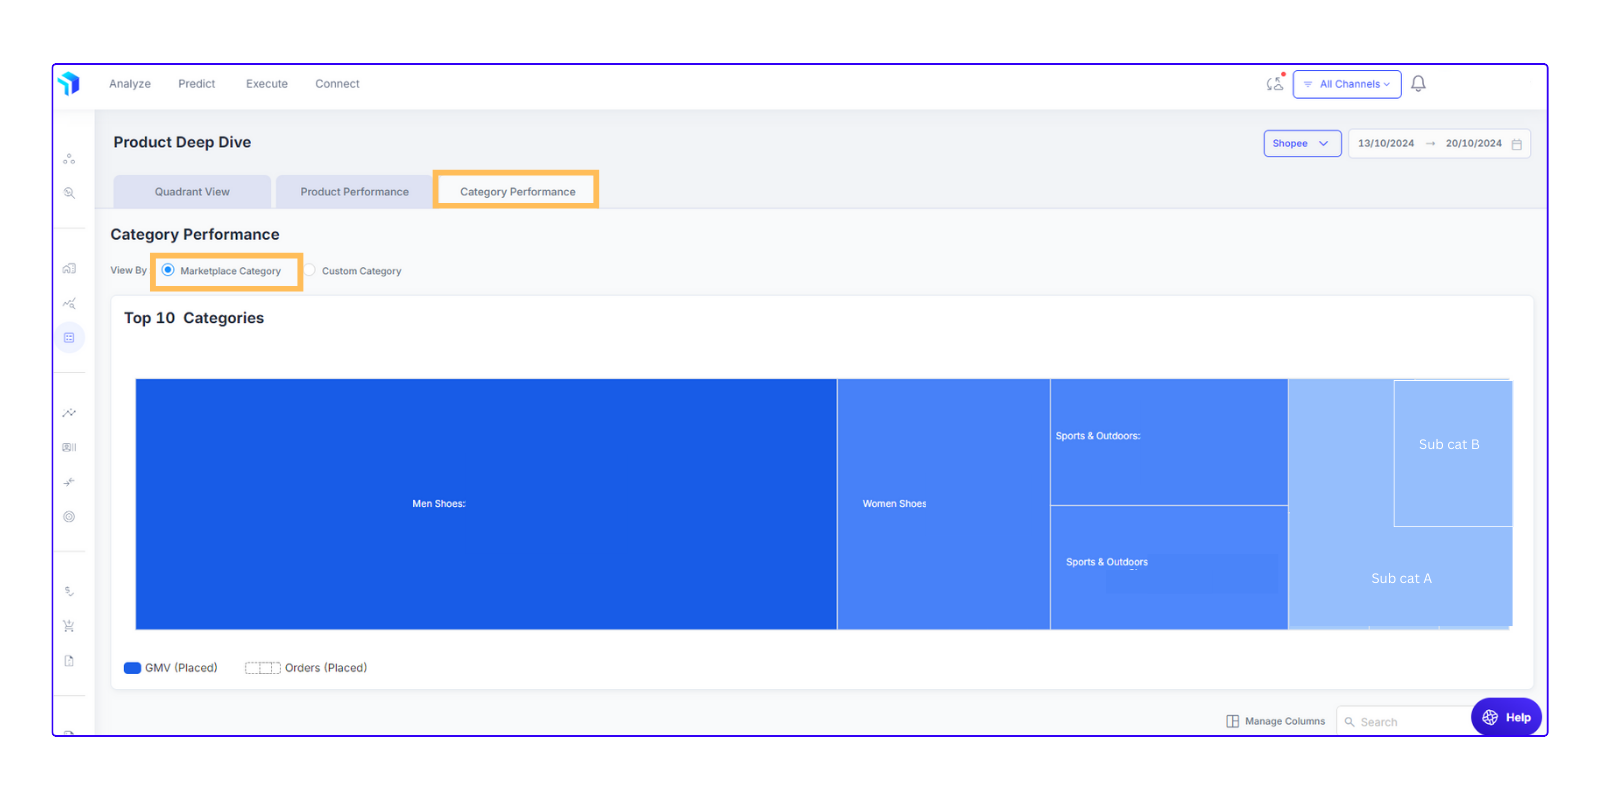
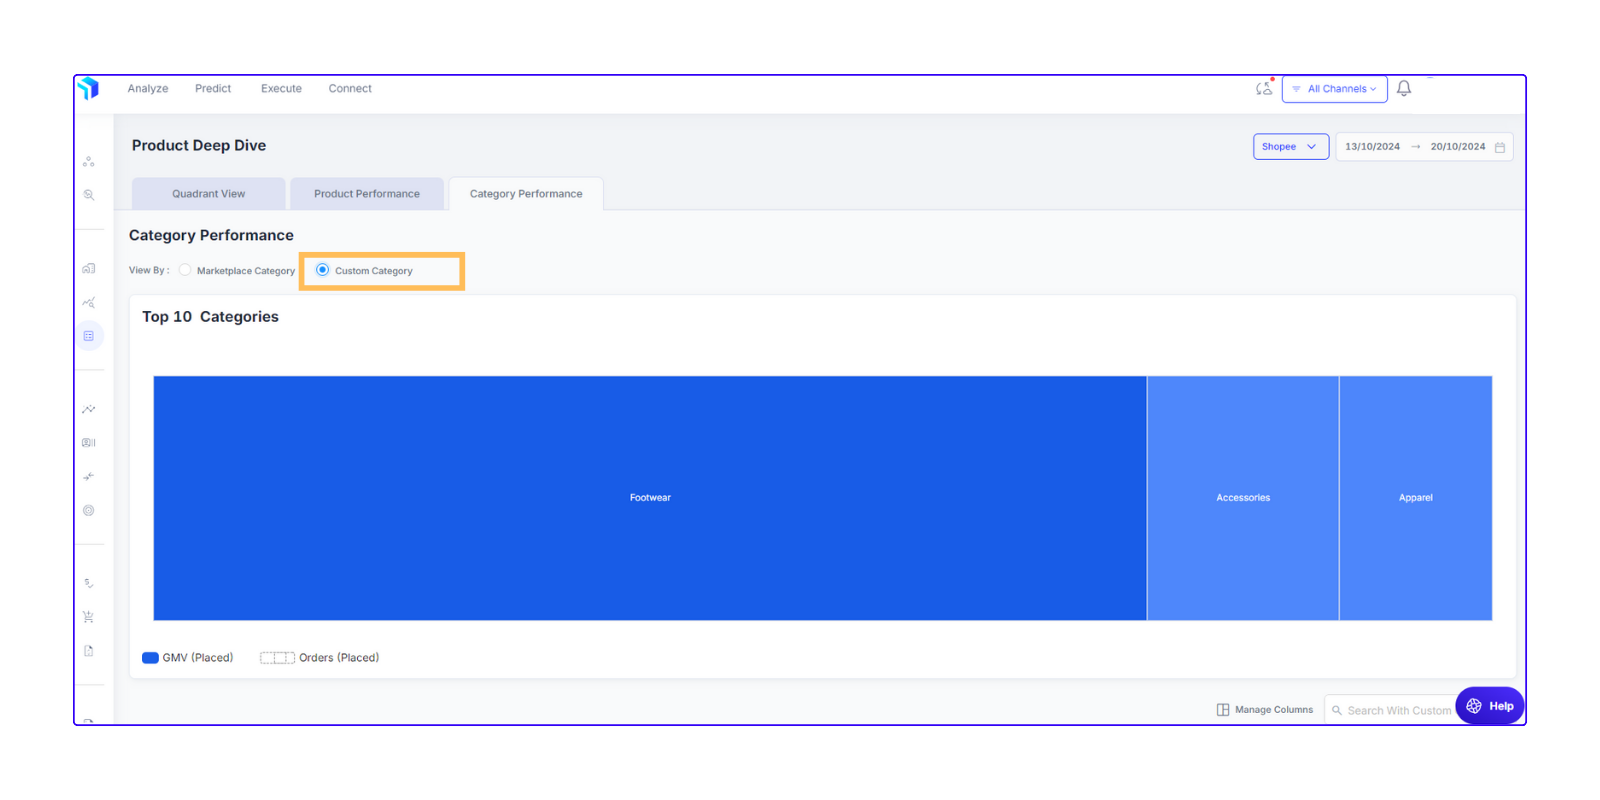
The Category Performance dashboard gives a clear, data-driven view of how each product category is contributing to your overall performance. It highlights top-performing categories, as well as those that may need optimization. By tracking key metrics such as traffic, quantity sold and GMV, this feature helps identify growth opportunities and areas that require strategic adjustments.
Category Performance offers the flexibility to monitor both marketplace categories and custom categories unique to your business. This ensures that, whether you are analyzing standard marketplace groupings or specialized categories tailored to your strategy, you can get a complete understanding of category-level performance. Category Performance provides the data-driven insights necessary to optimize your product offerings.
Related Article(s):
Quadrant View
Product Performance

