
Business Deep Dive: How to analyze your performance using different views
Video Walkthrough
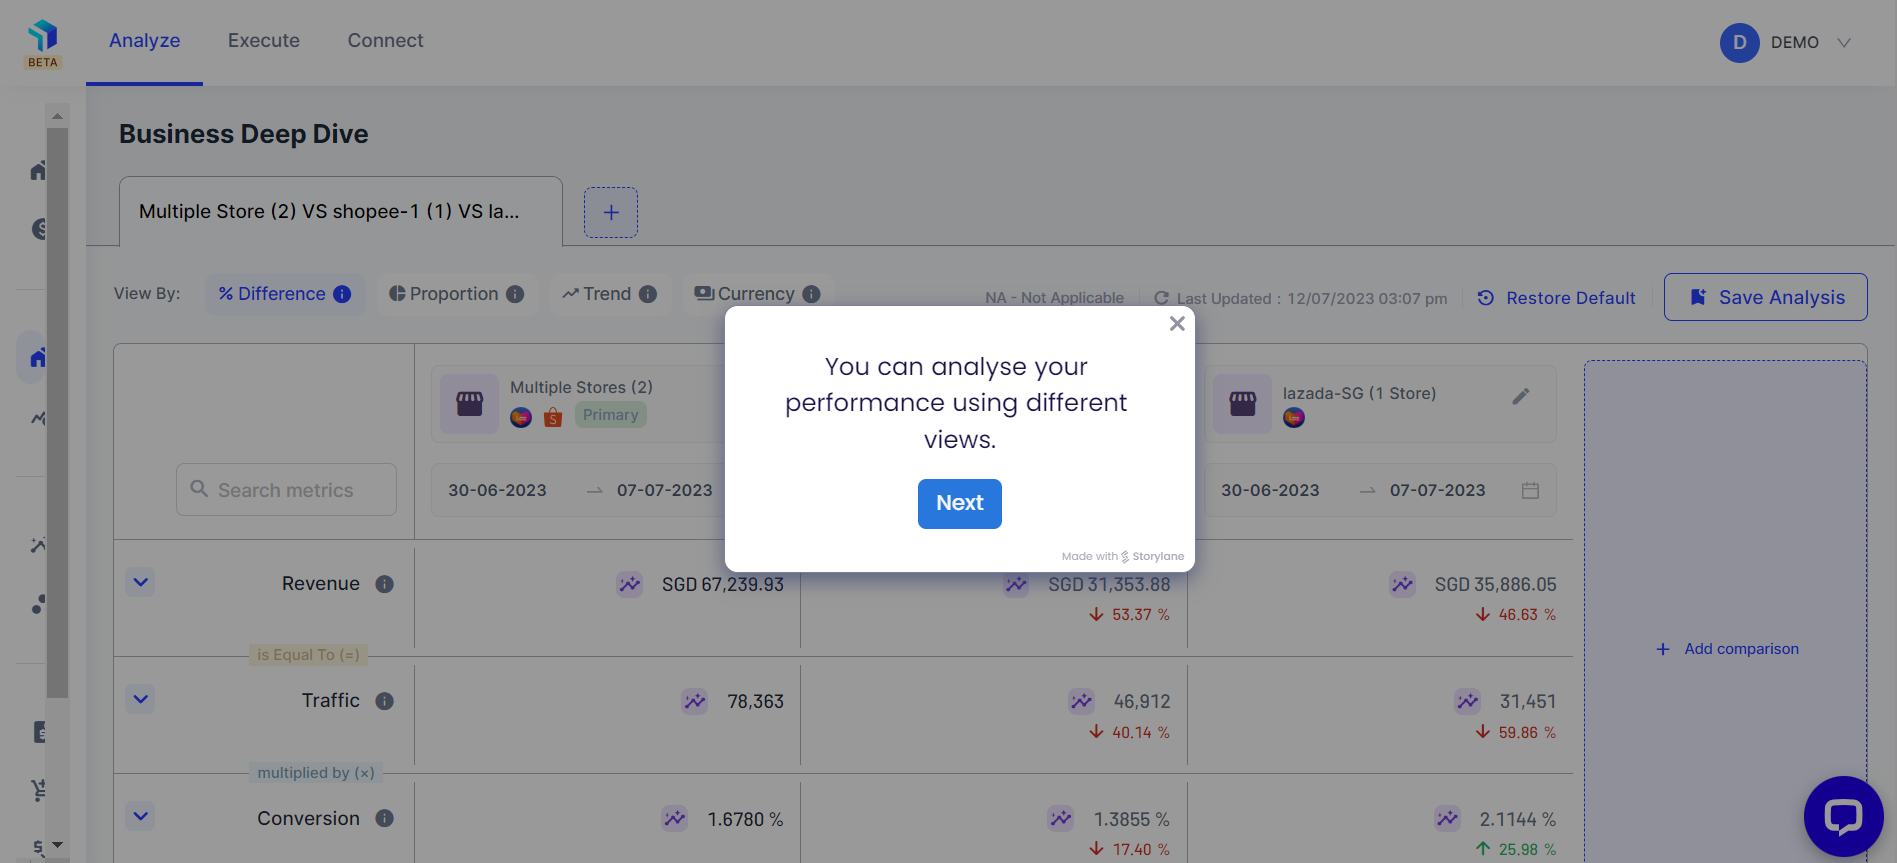
Steps to access the Business Deep Dive
Click on Analyze > Deep Dive > Business Deep Dive
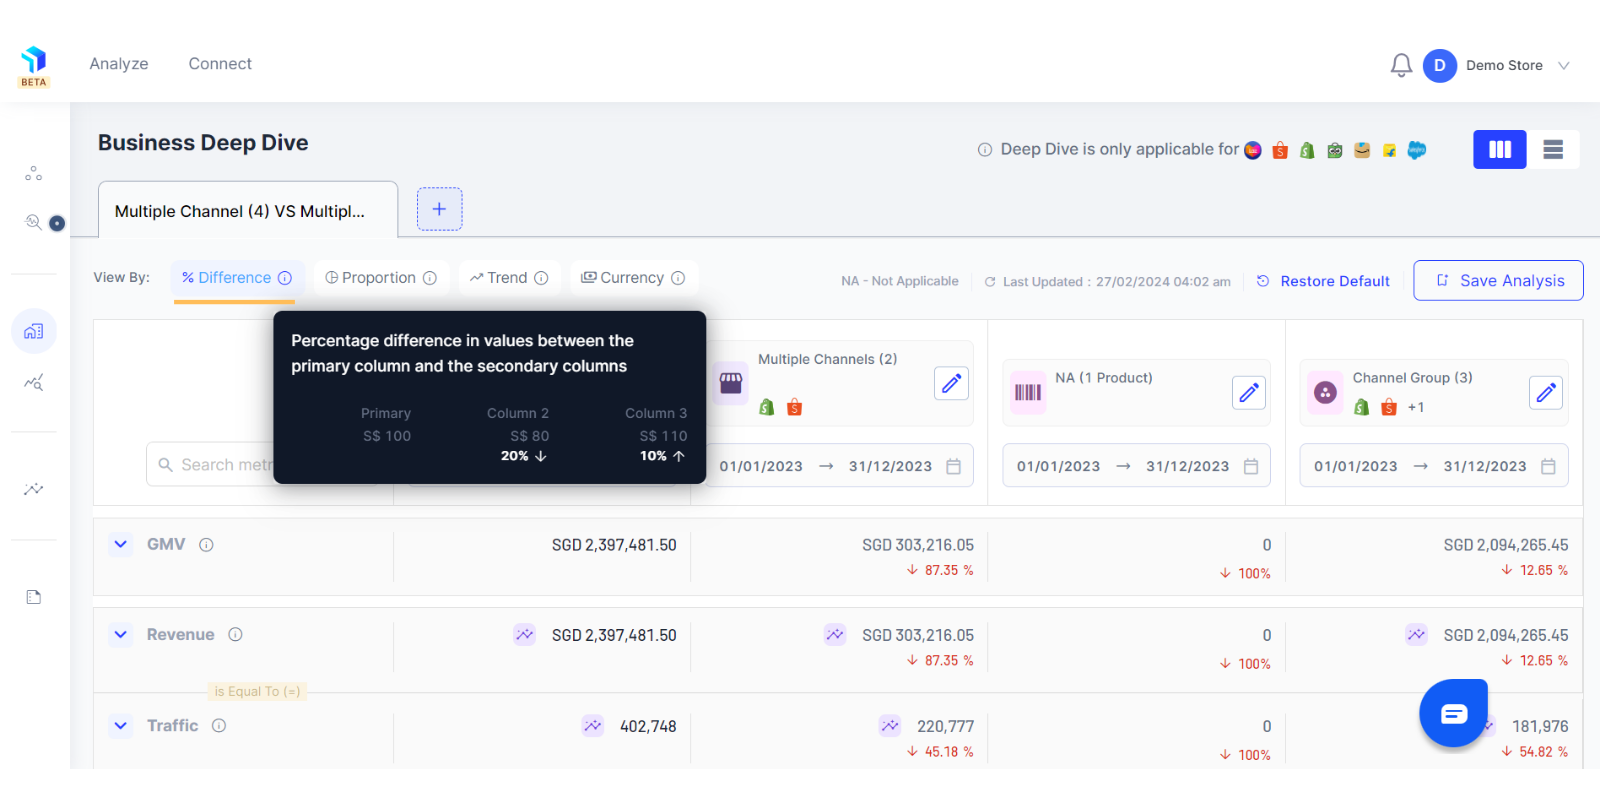
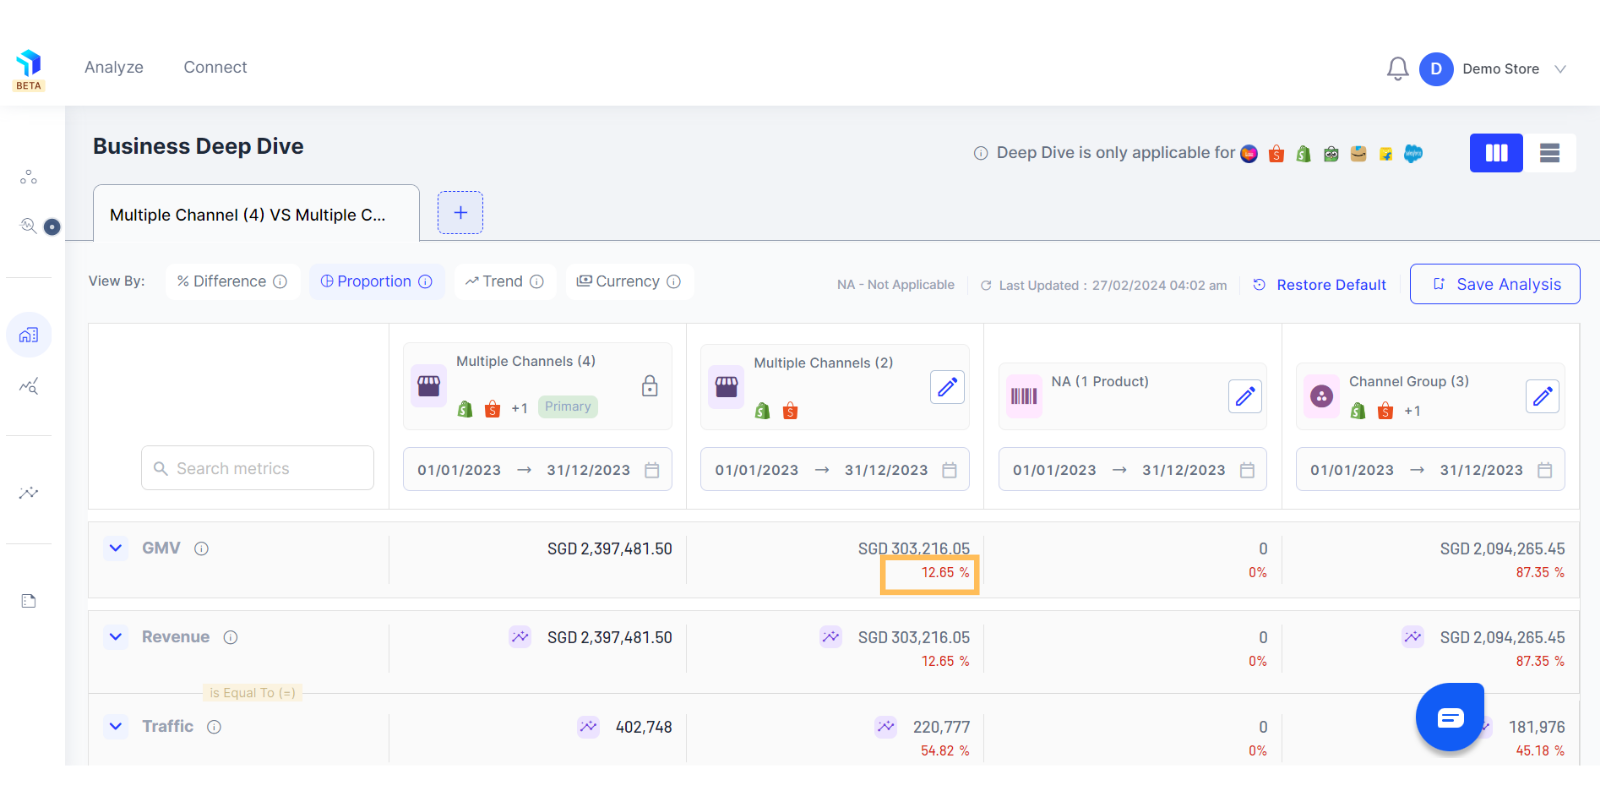
1. If you select the Difference button at the top of the dashboard, it will indicate the percentage difference in values between your primary column and the secondary columns.
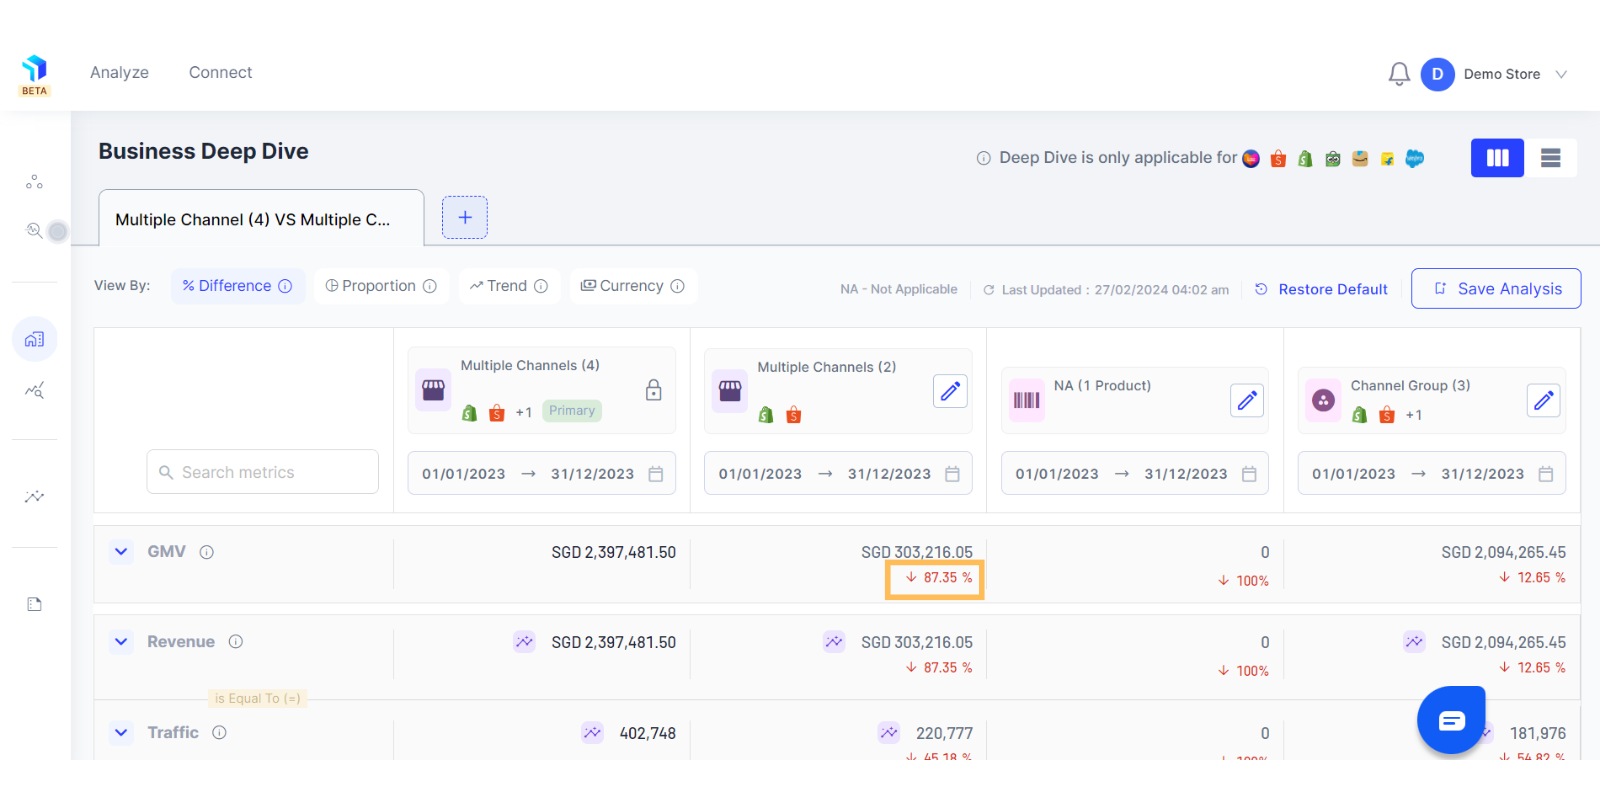
2. You will see the increase or decrease in the metric value as a % change on the data point that you have selected. For instance, in the below image the data point being looked at is the revenue metric in the secondary column.
3. To look at the values in secondary columns as a percentage of the primary column, use the Proportion view.
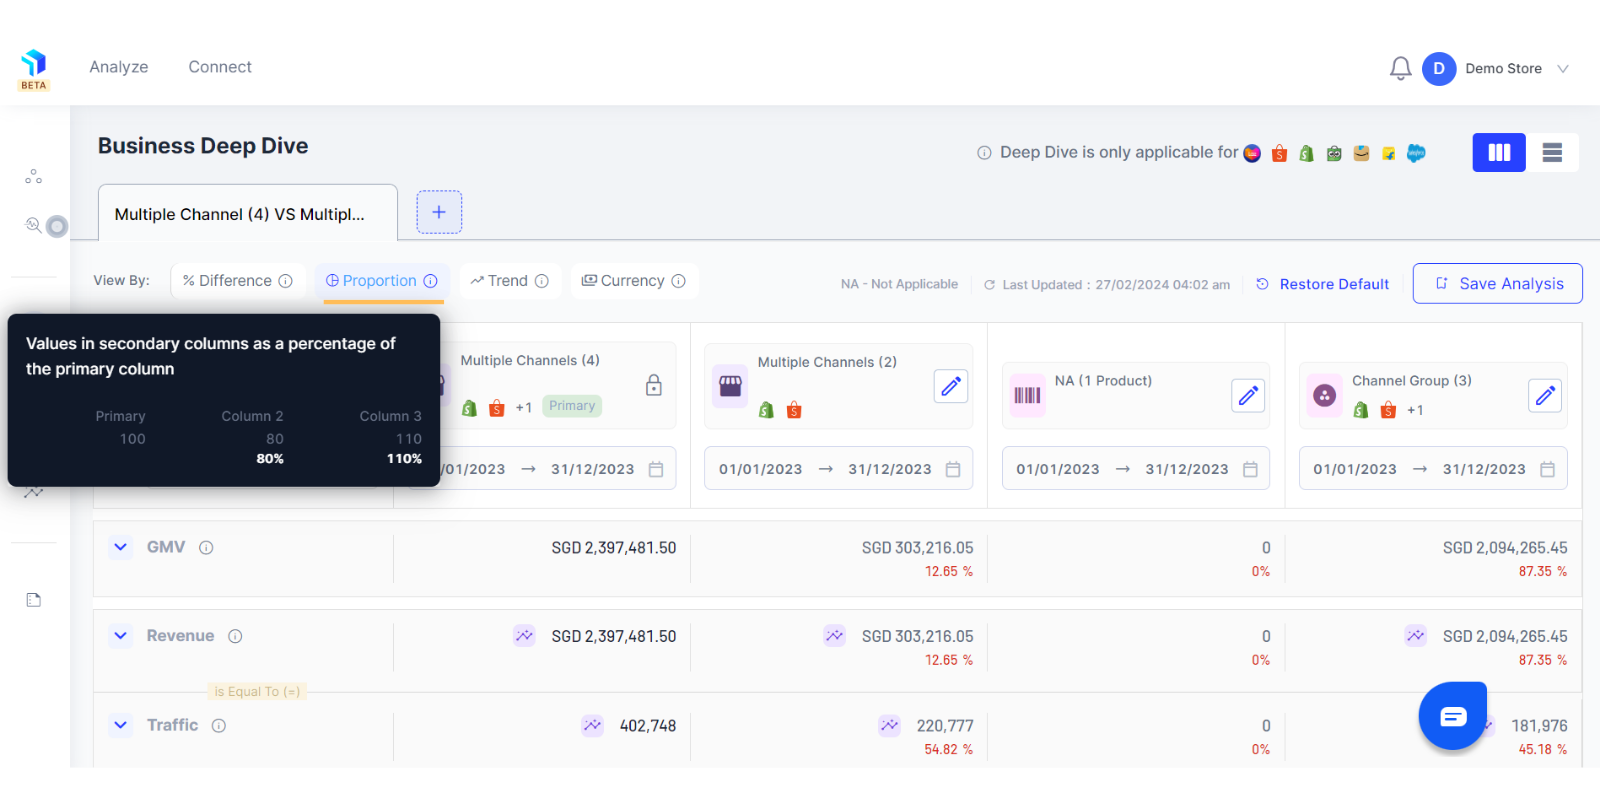
4. You will see the secondary columns as a percentage of the primary column on the data point that you have selected.
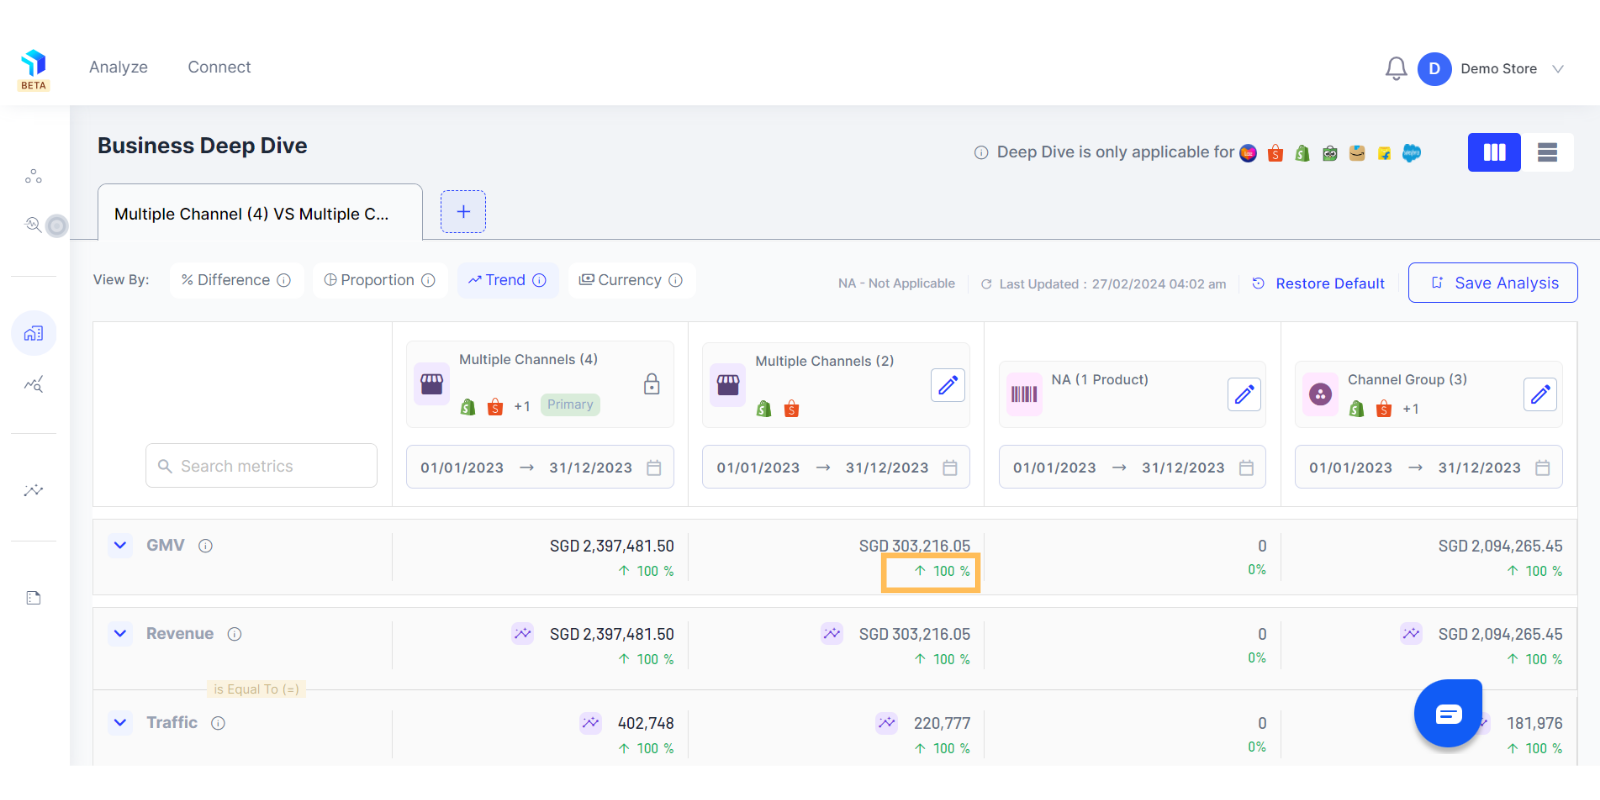
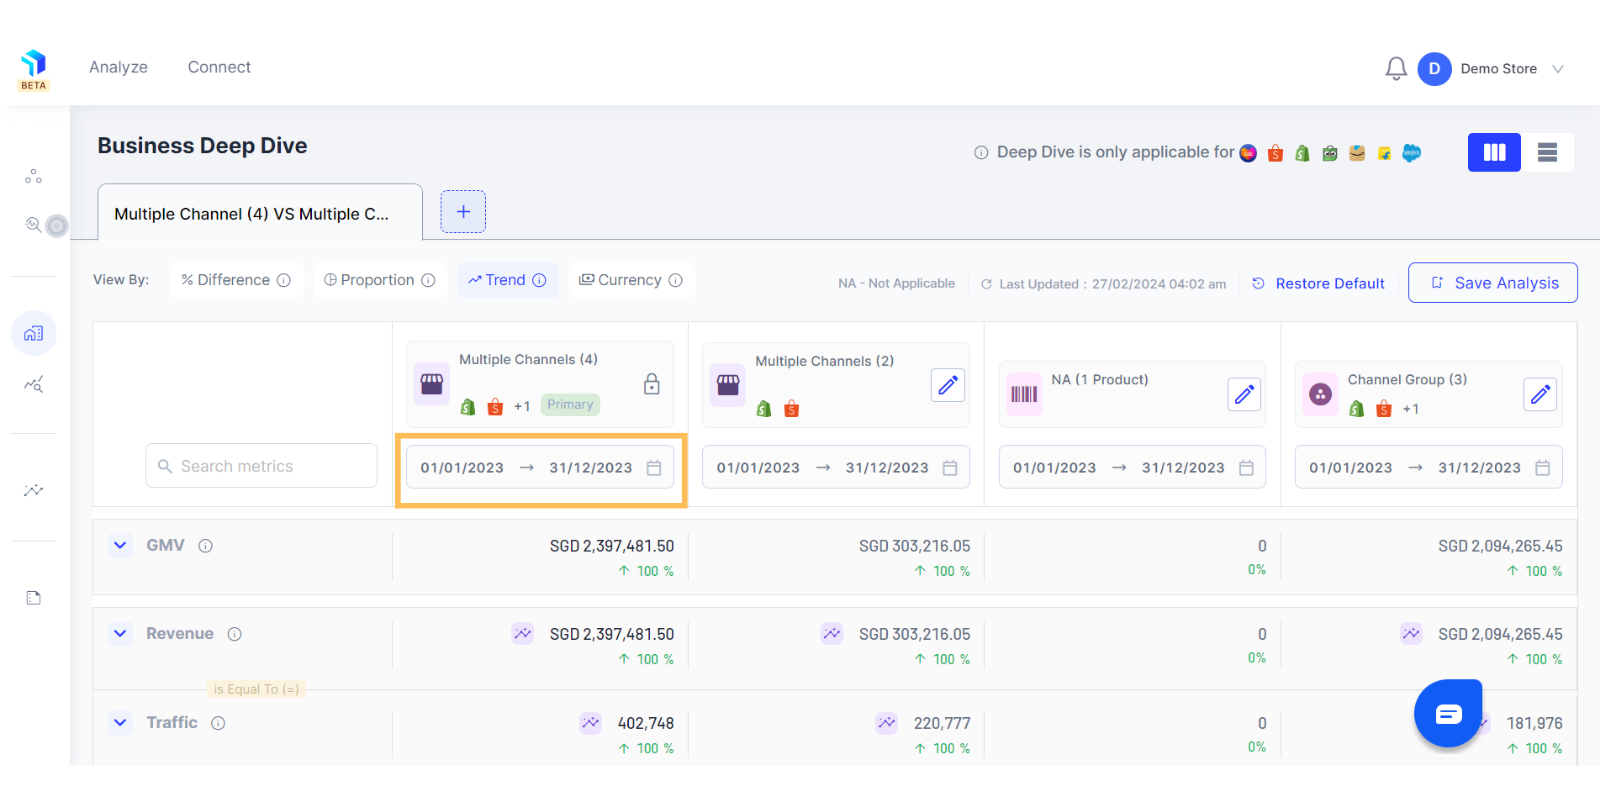
5. To identify a change in values between the current and a previous time period, use the Trend view.
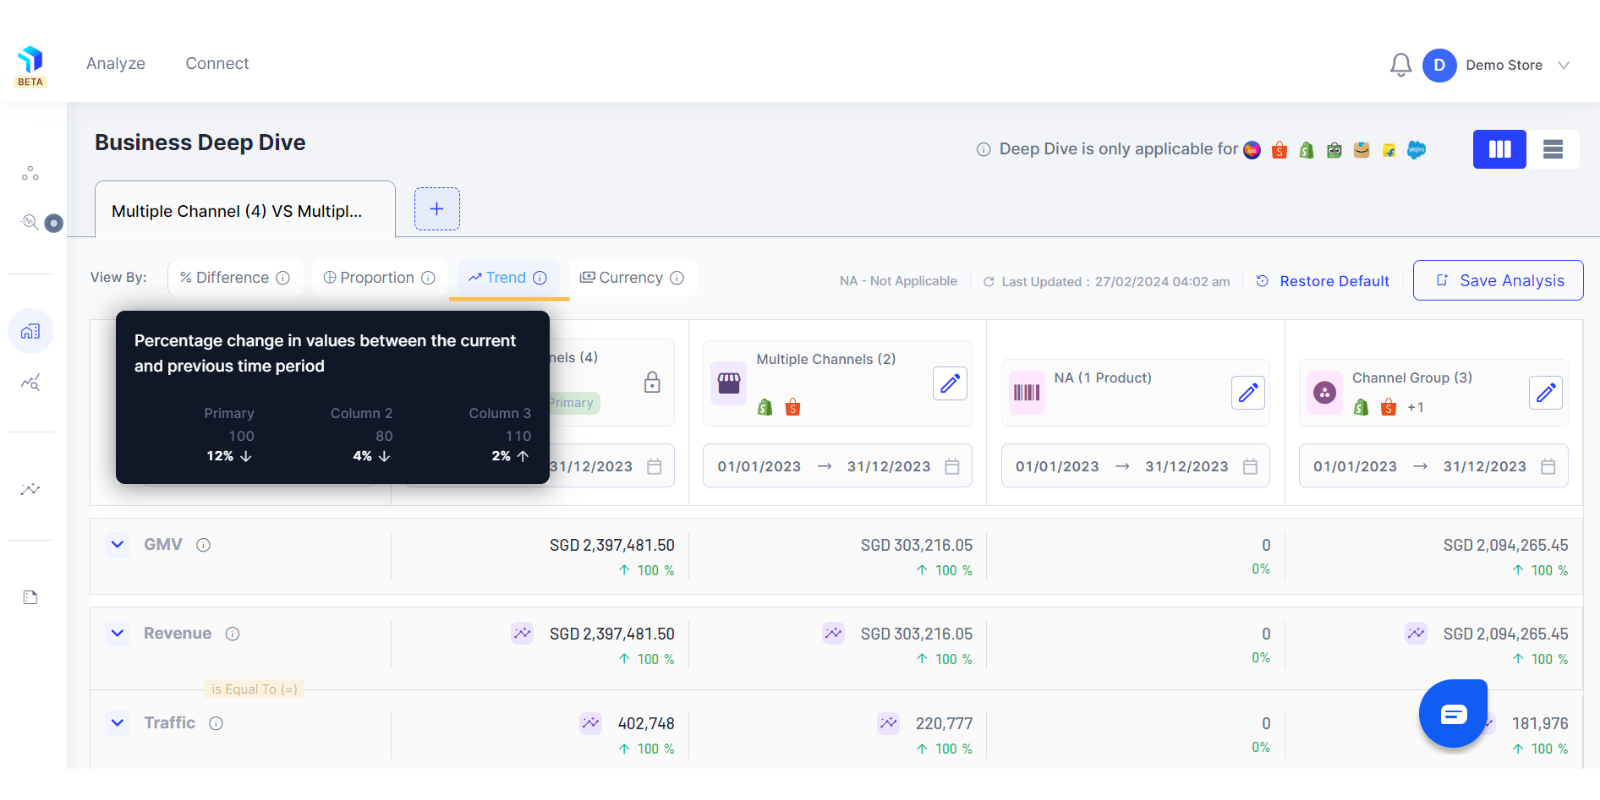
6. You will see the percentage change in values between the current and previous time period on the data point that you have selected.
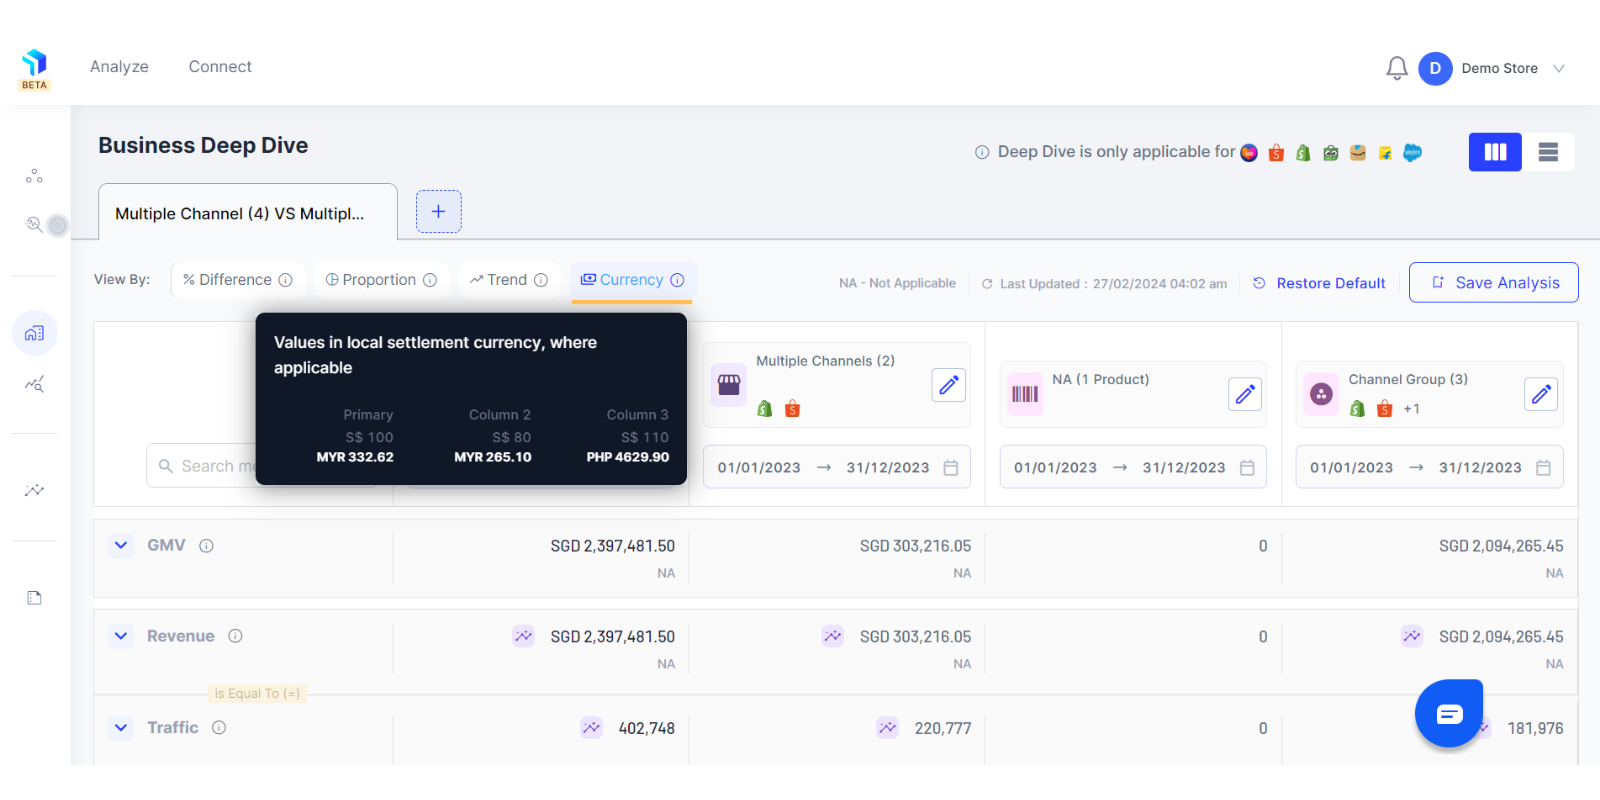
7. To look at values in local settlement currency, use the Currency view and you will see the money value in the converted currency option.
8. You can edit the time range based on the period you want to analyze.
Related Article(s):
Business Deep Dive: Overview
What is the eCommerce Equation
Business Deep Dive: How to build multiple analysis
Business Deep Dive: How to add secondary column for business metrics comparison