
eCommerce Dashboard Overview
Steps to access the eCommerce Dashboard
Click on Analyze > Workspace > eCommerce Dashboard
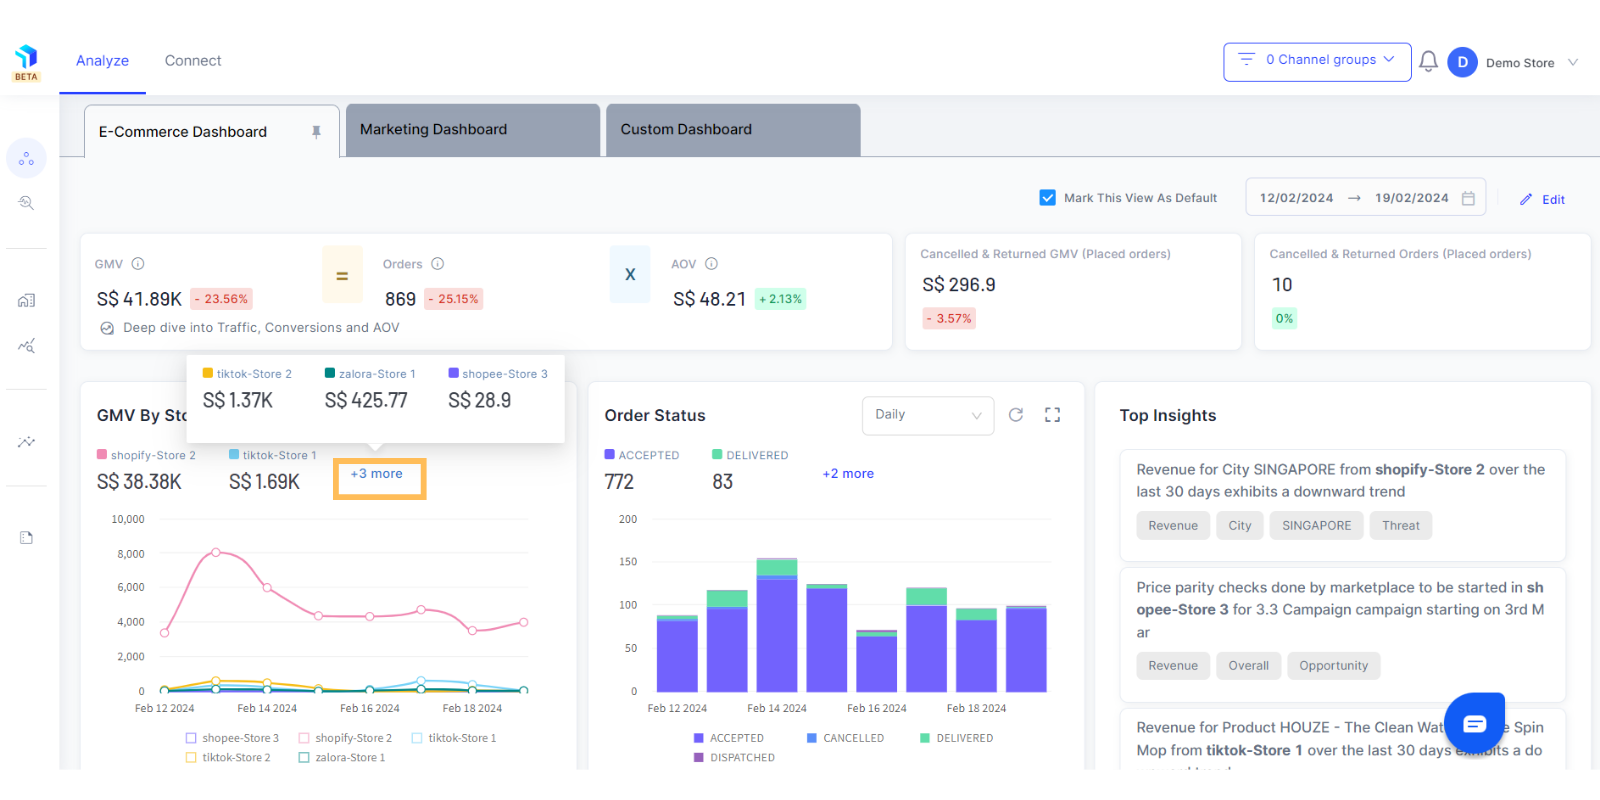
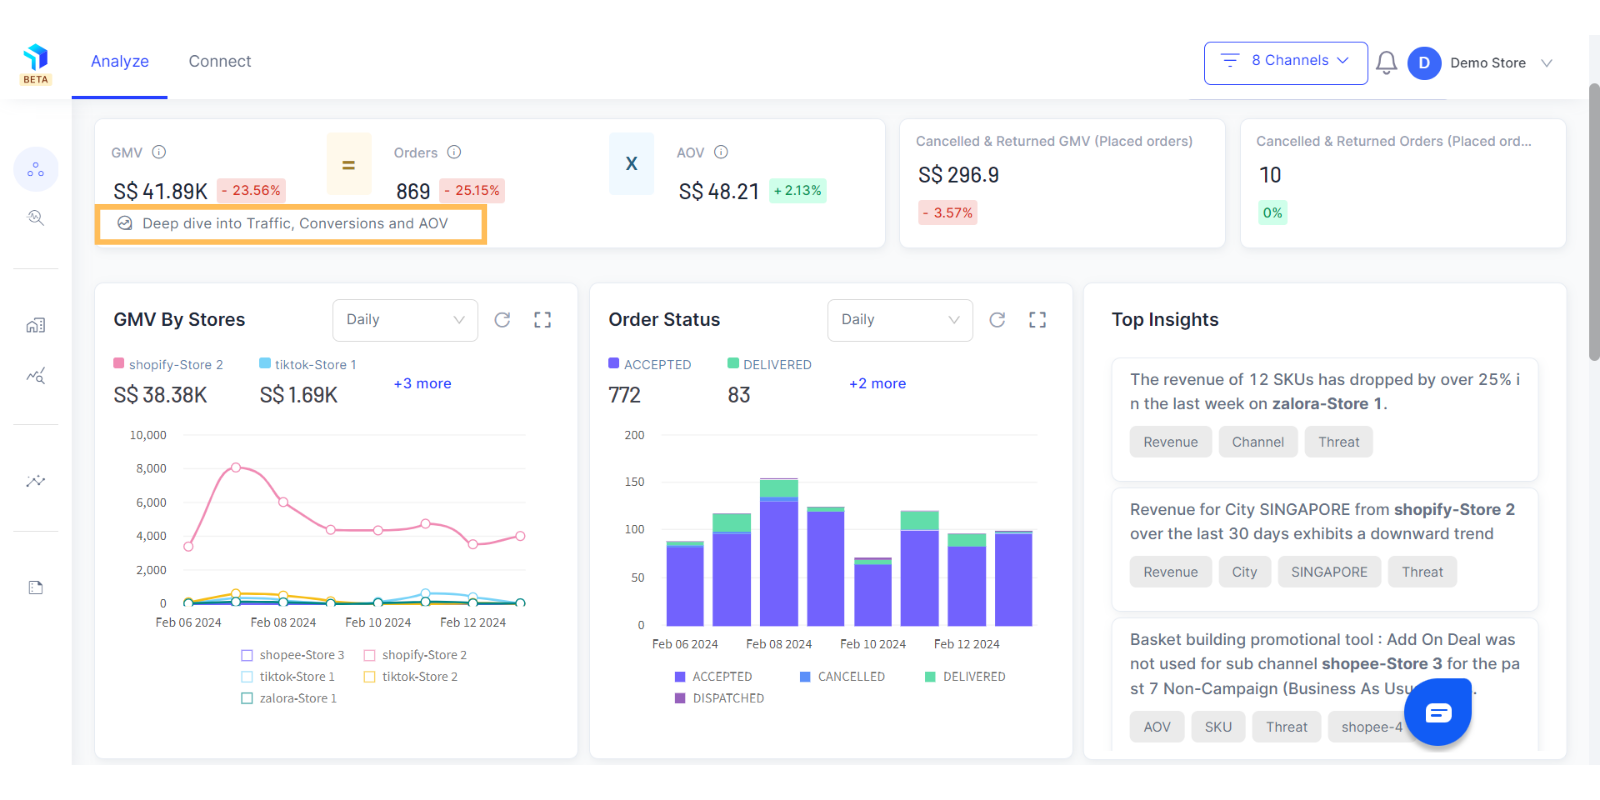
1. The dashboard displays high level metrics via the eCommerce equation, which is GMV = Orders x AOV. You also get to see additional metrics related to your orders & store performance like Canceled and Returned Revenue.
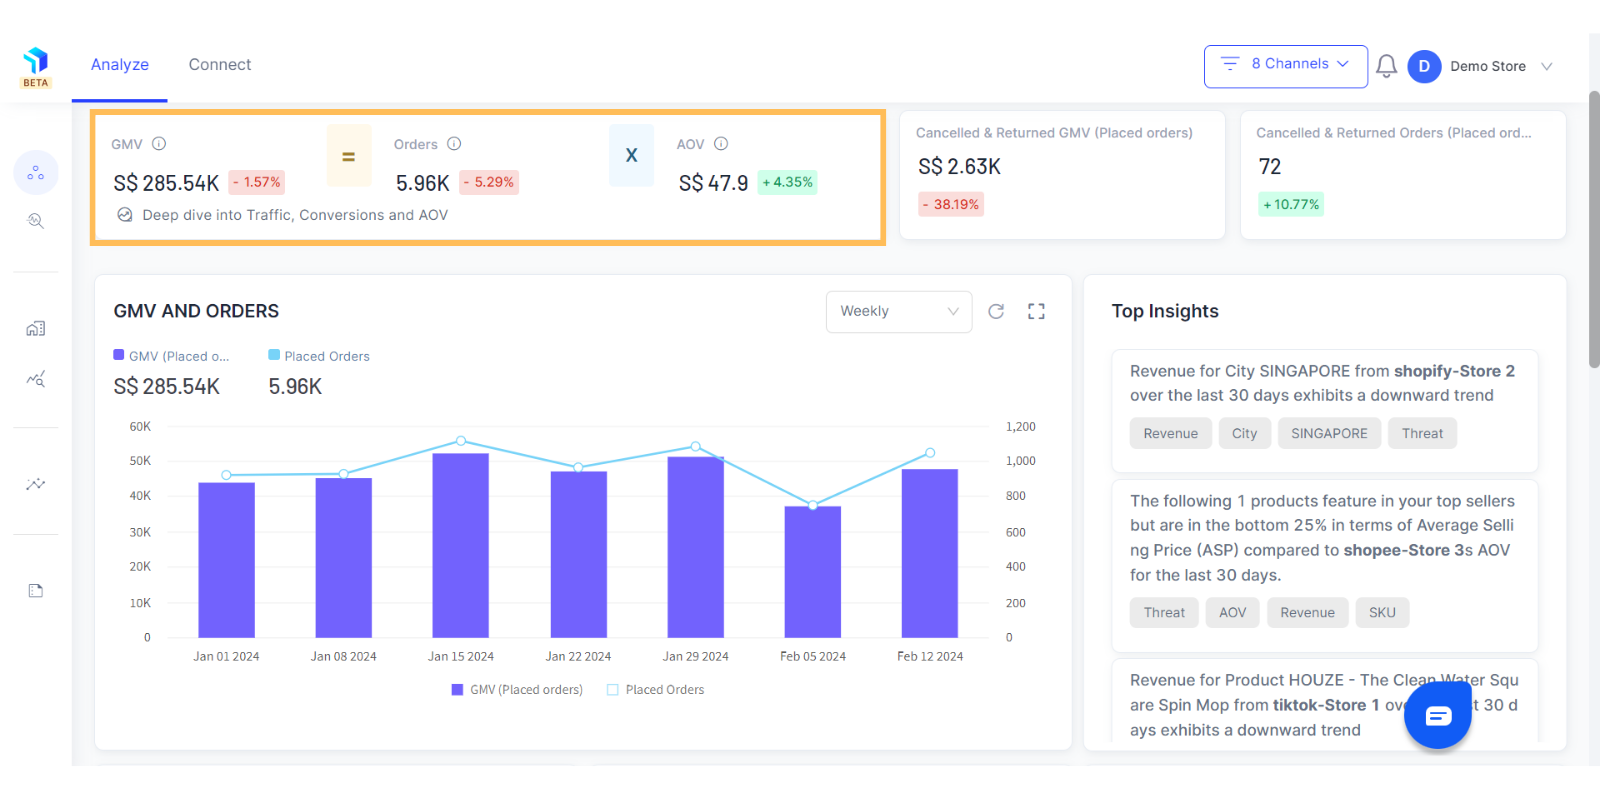
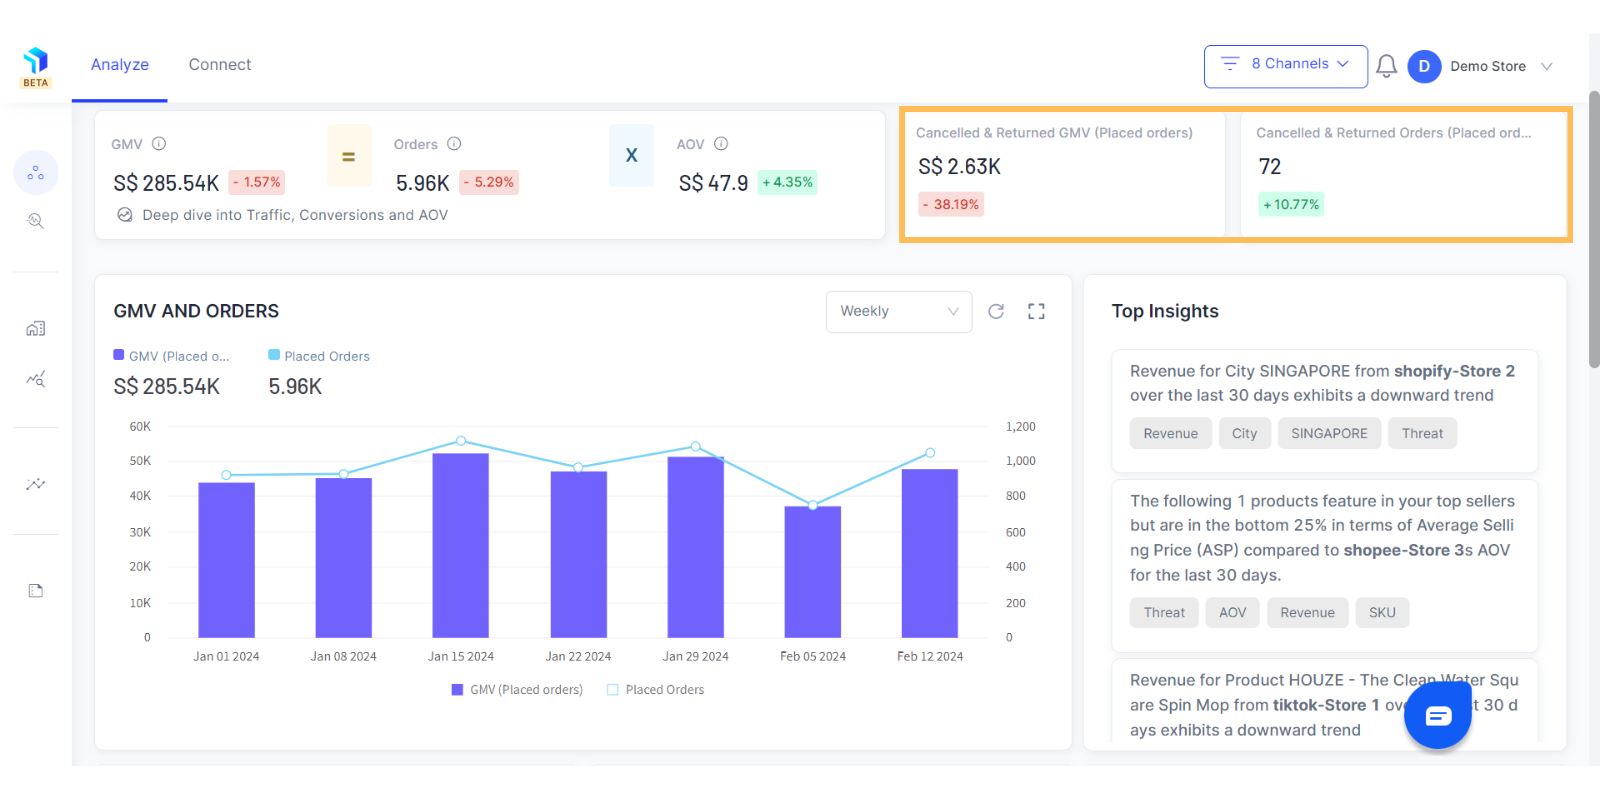
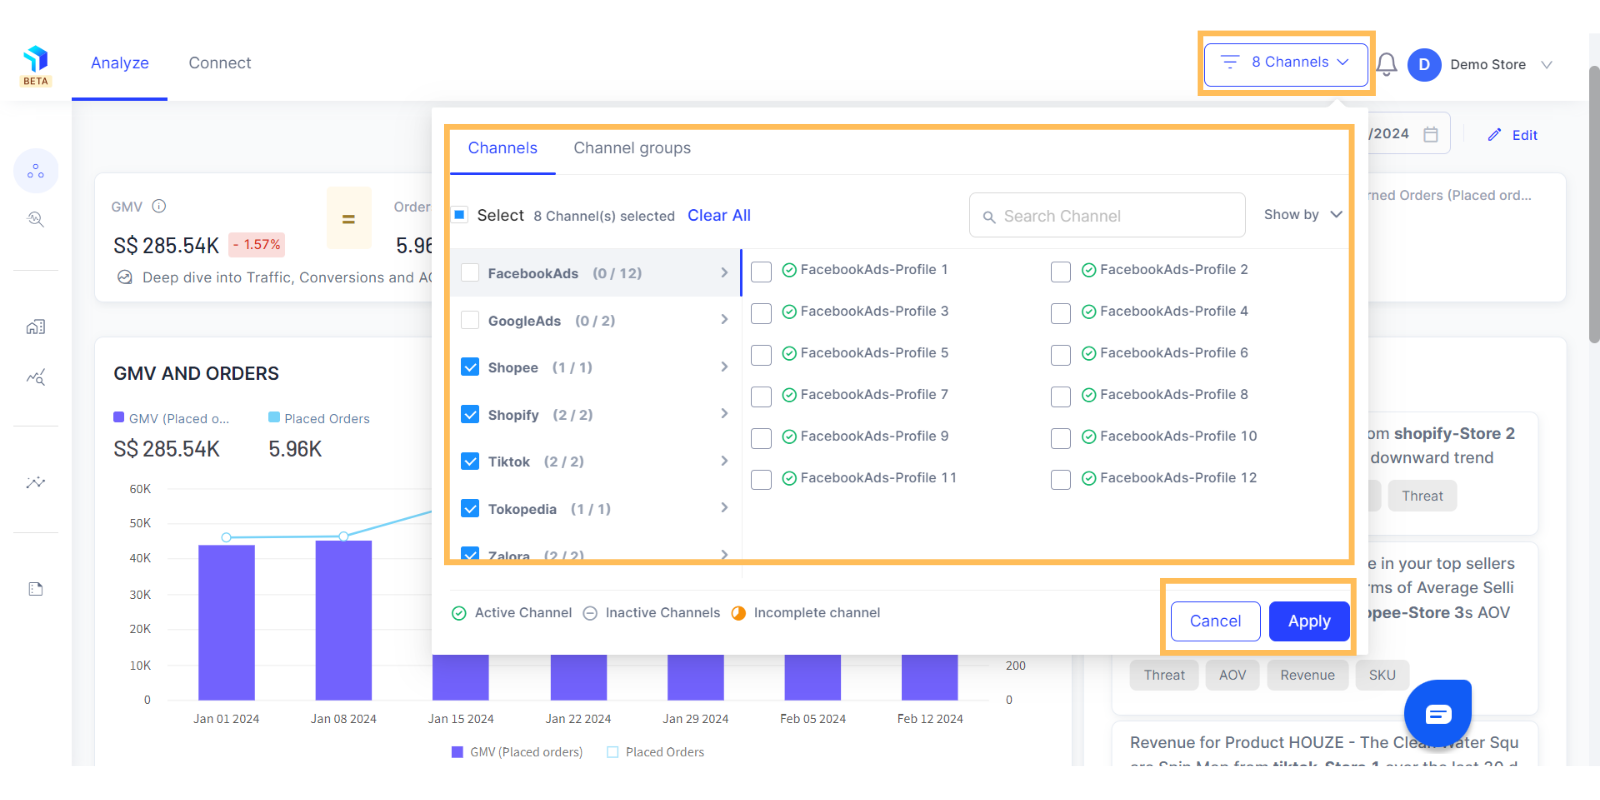
2. There are many cards in your dashboard and each one tracks different metrics. All of these are customizable. You can also add or delete cards as needed.
3. You can select the date range for which you want to see the report. 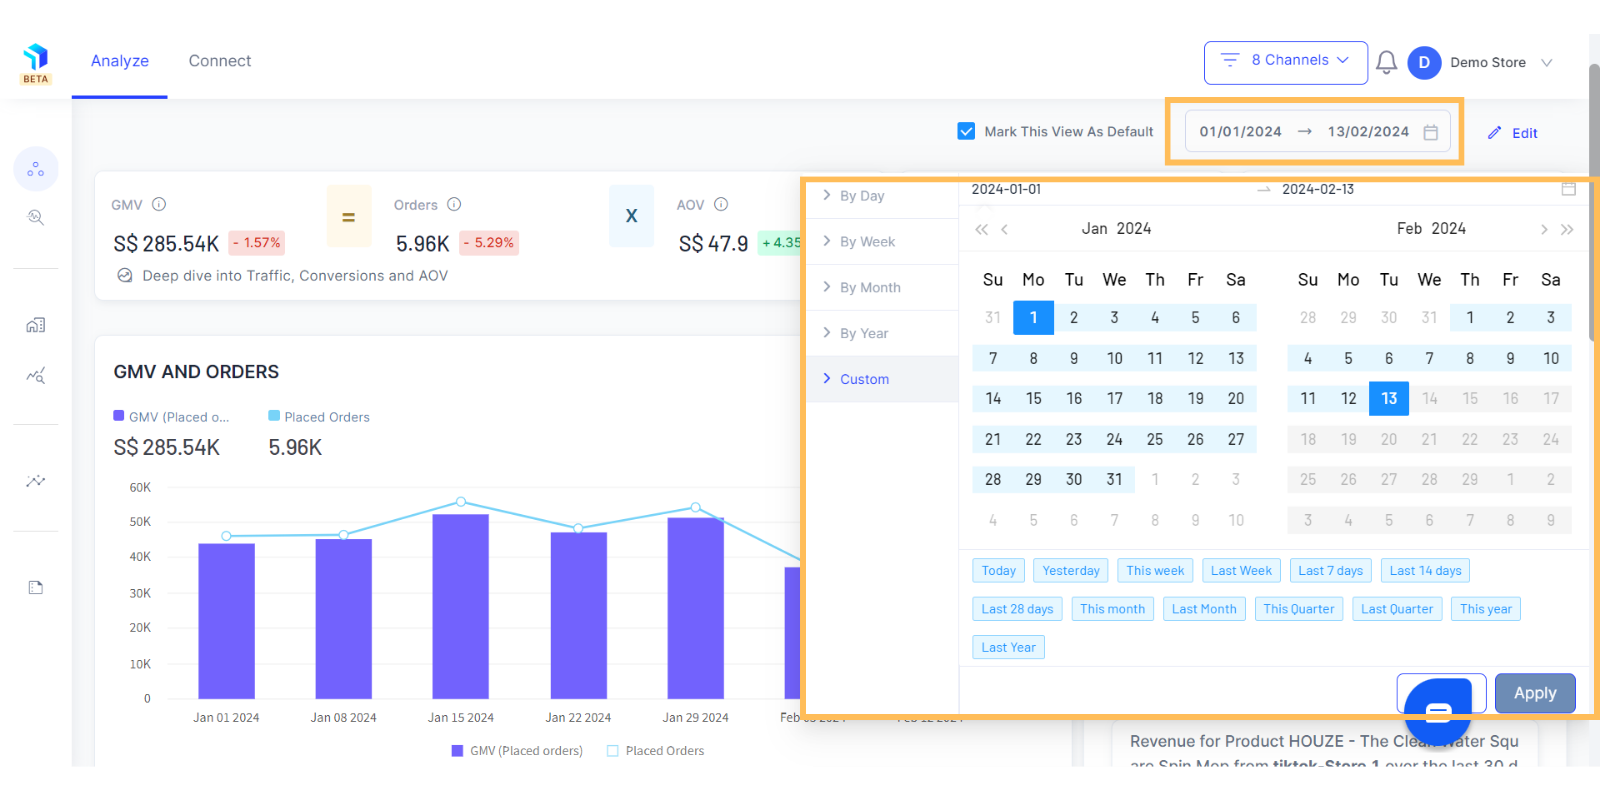
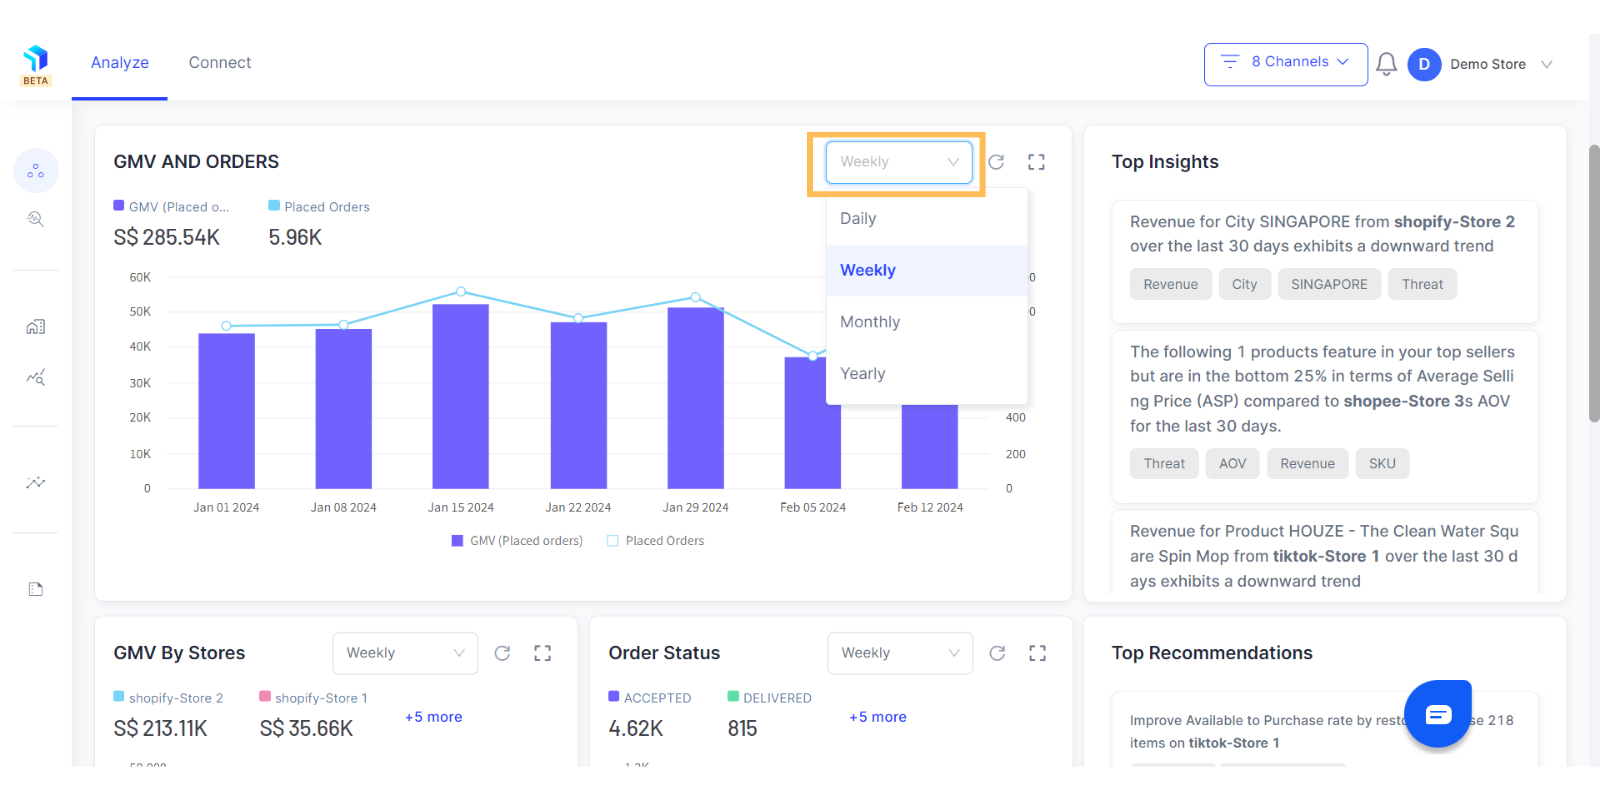
5. You can click on the dropdown as shown below to select your data view i.e.- if you want to see Daily, Weekly, Monthly, Yearly data for the time period you have selected.
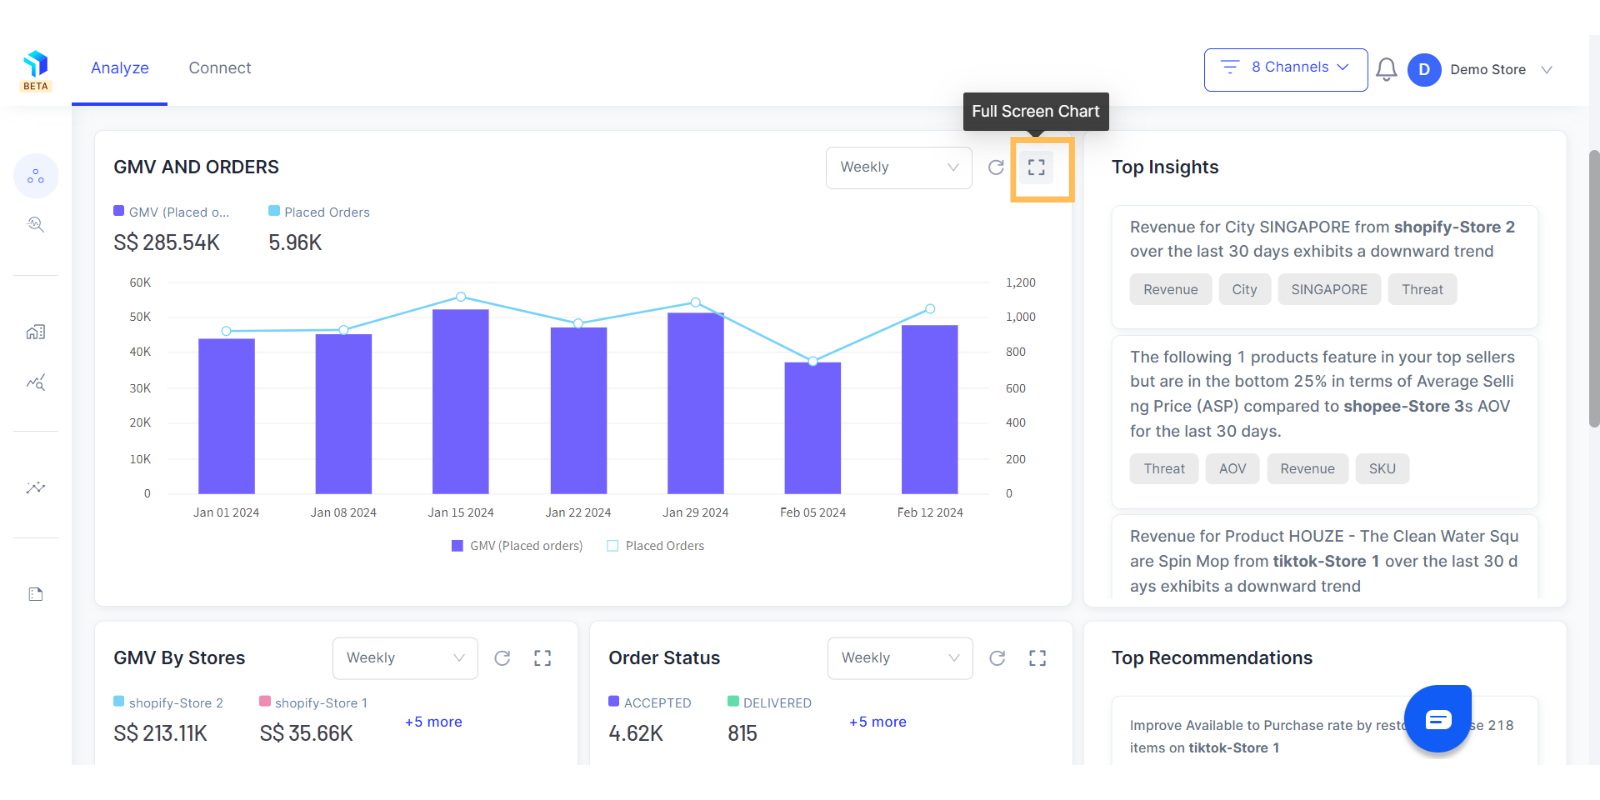
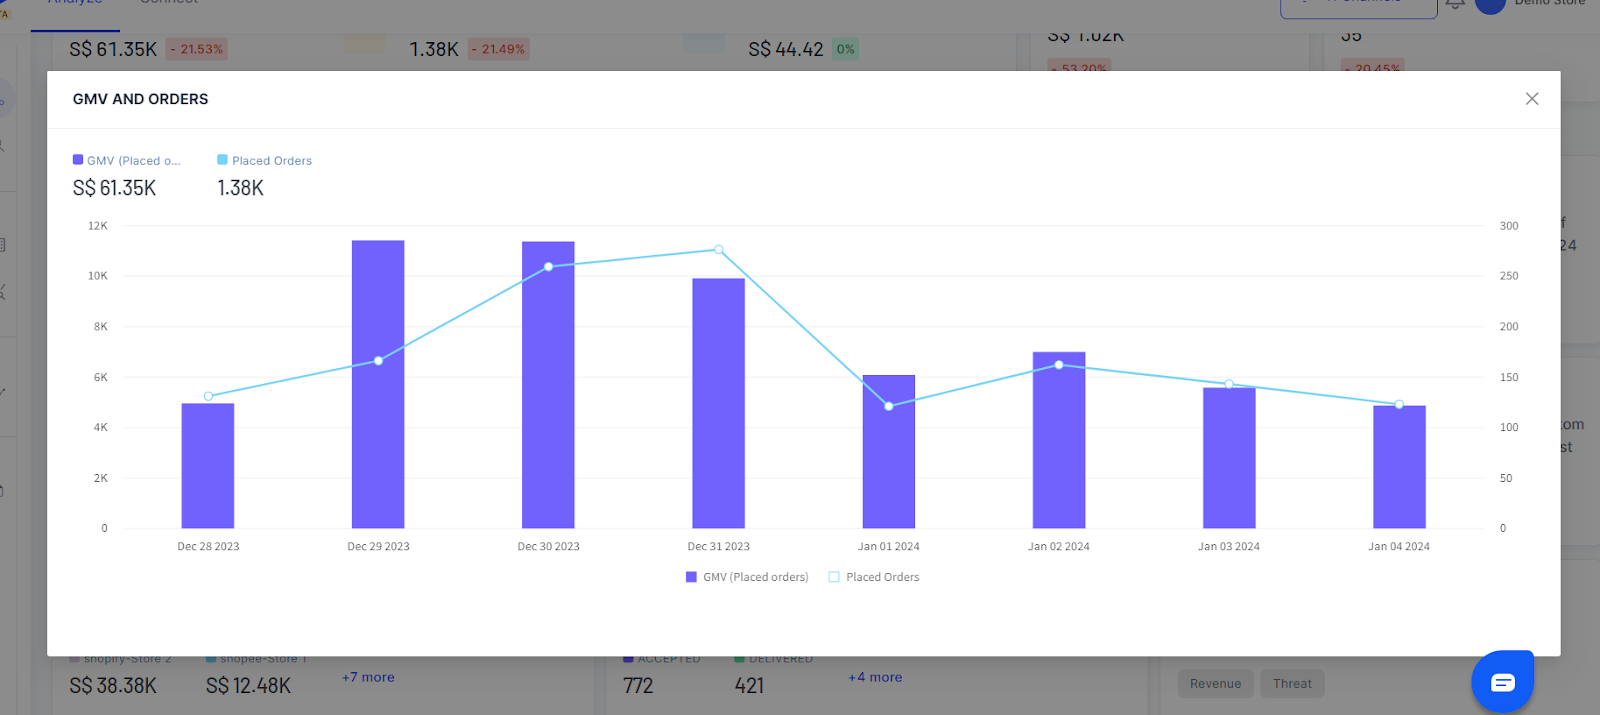
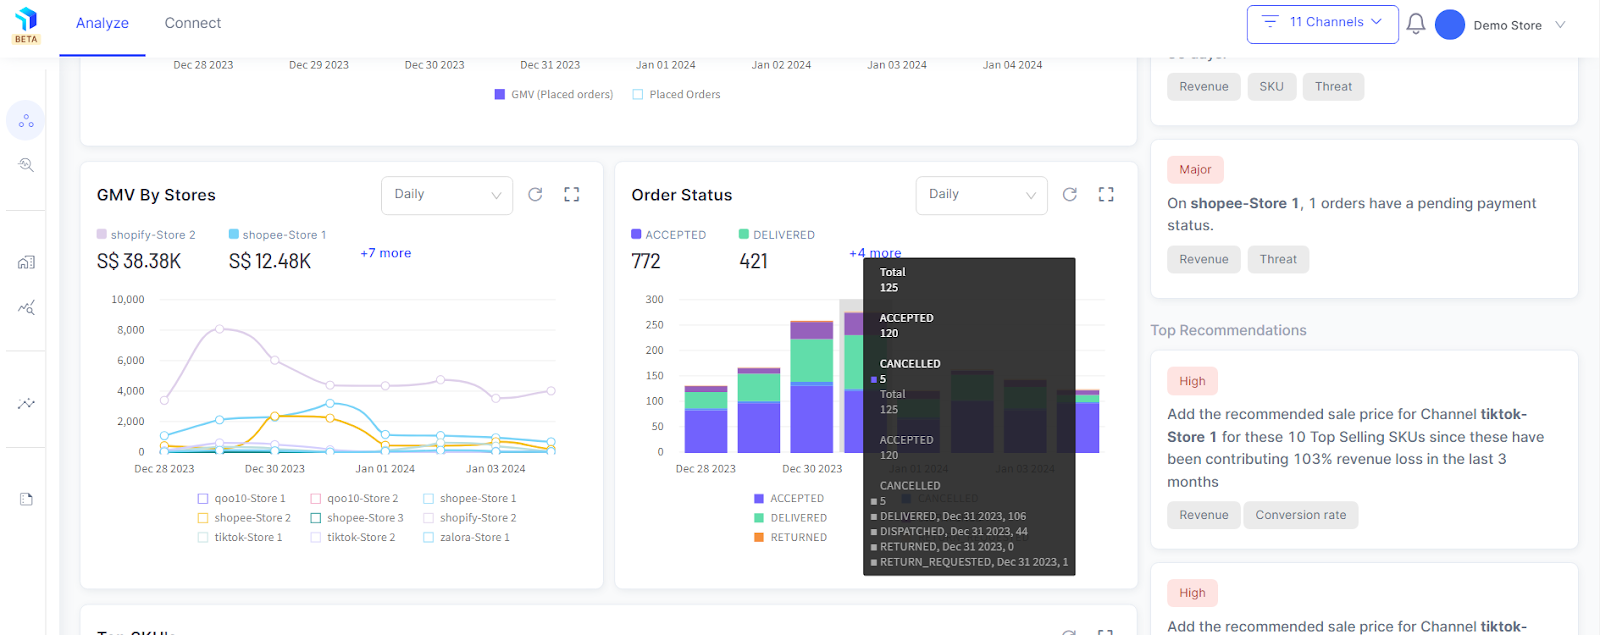
6. Click on the Expand icon to see your graph in full view screen as shown below.
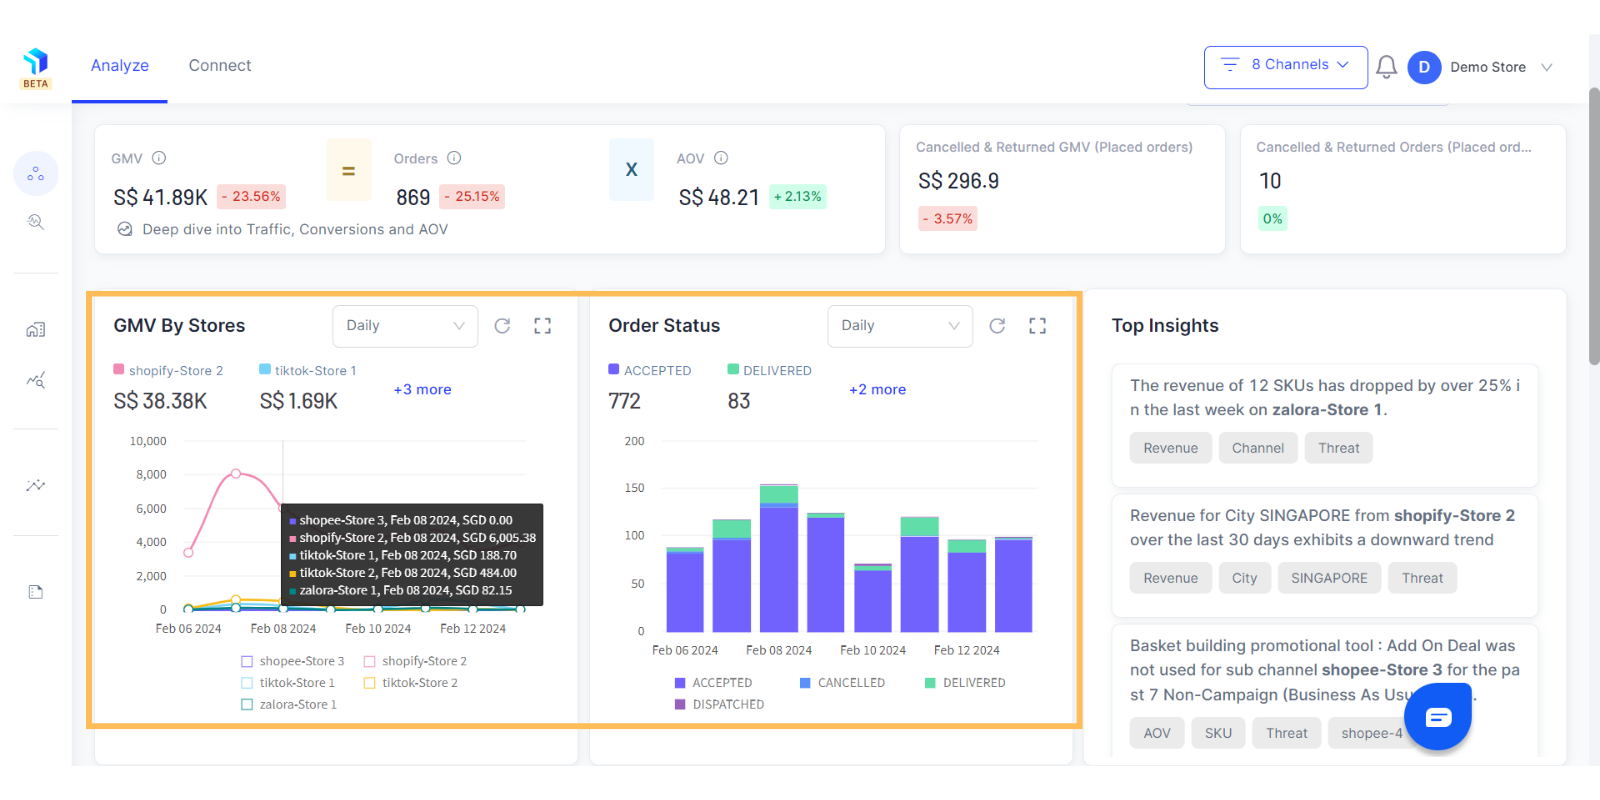
7. Click on the + sign on any graph to see the full list of variables measured and you can hover over the graphs to understand detailed breakdowns.
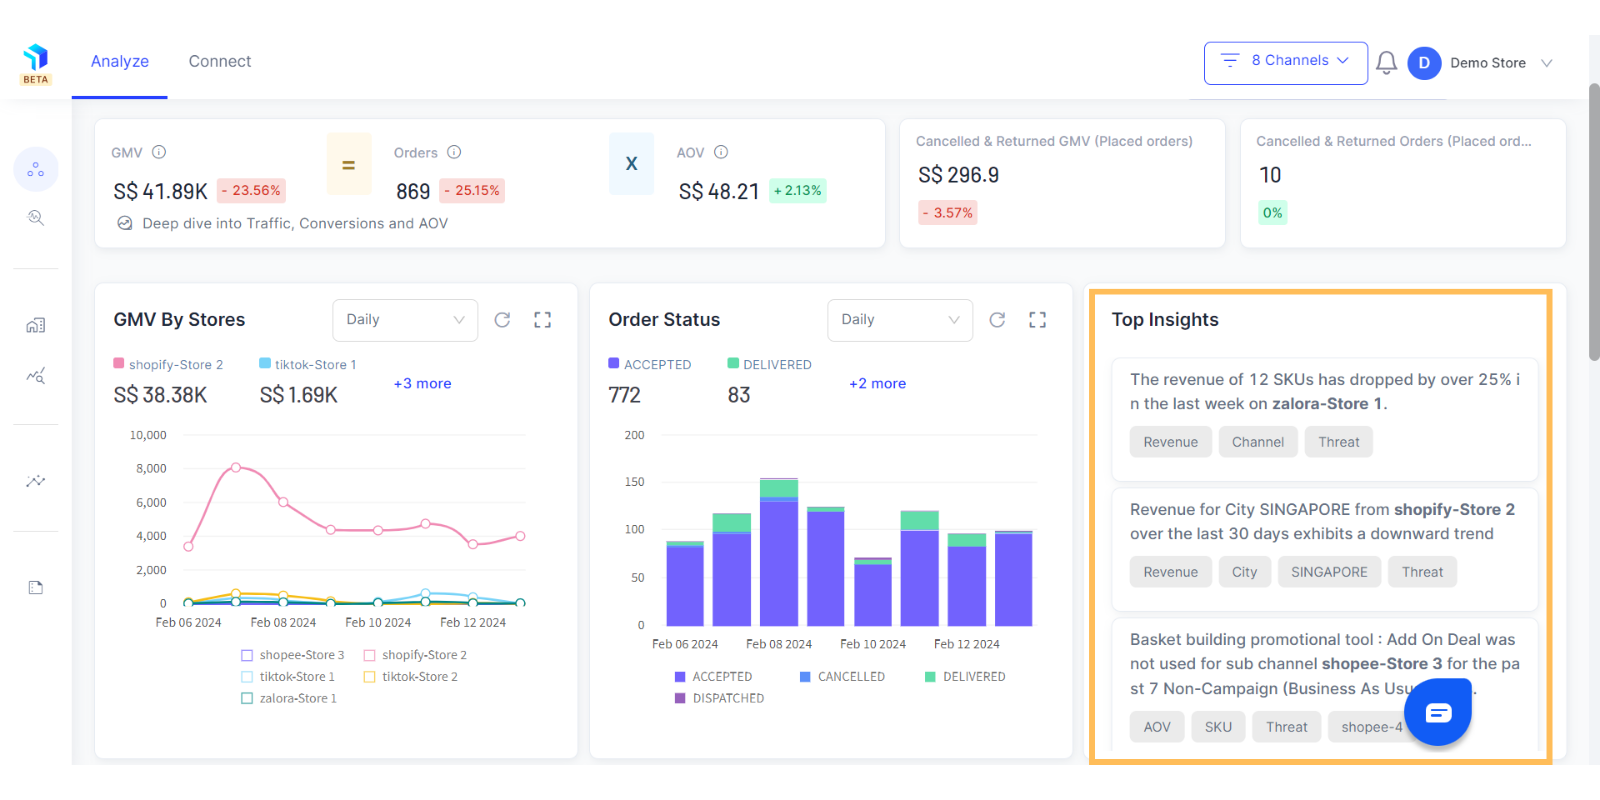
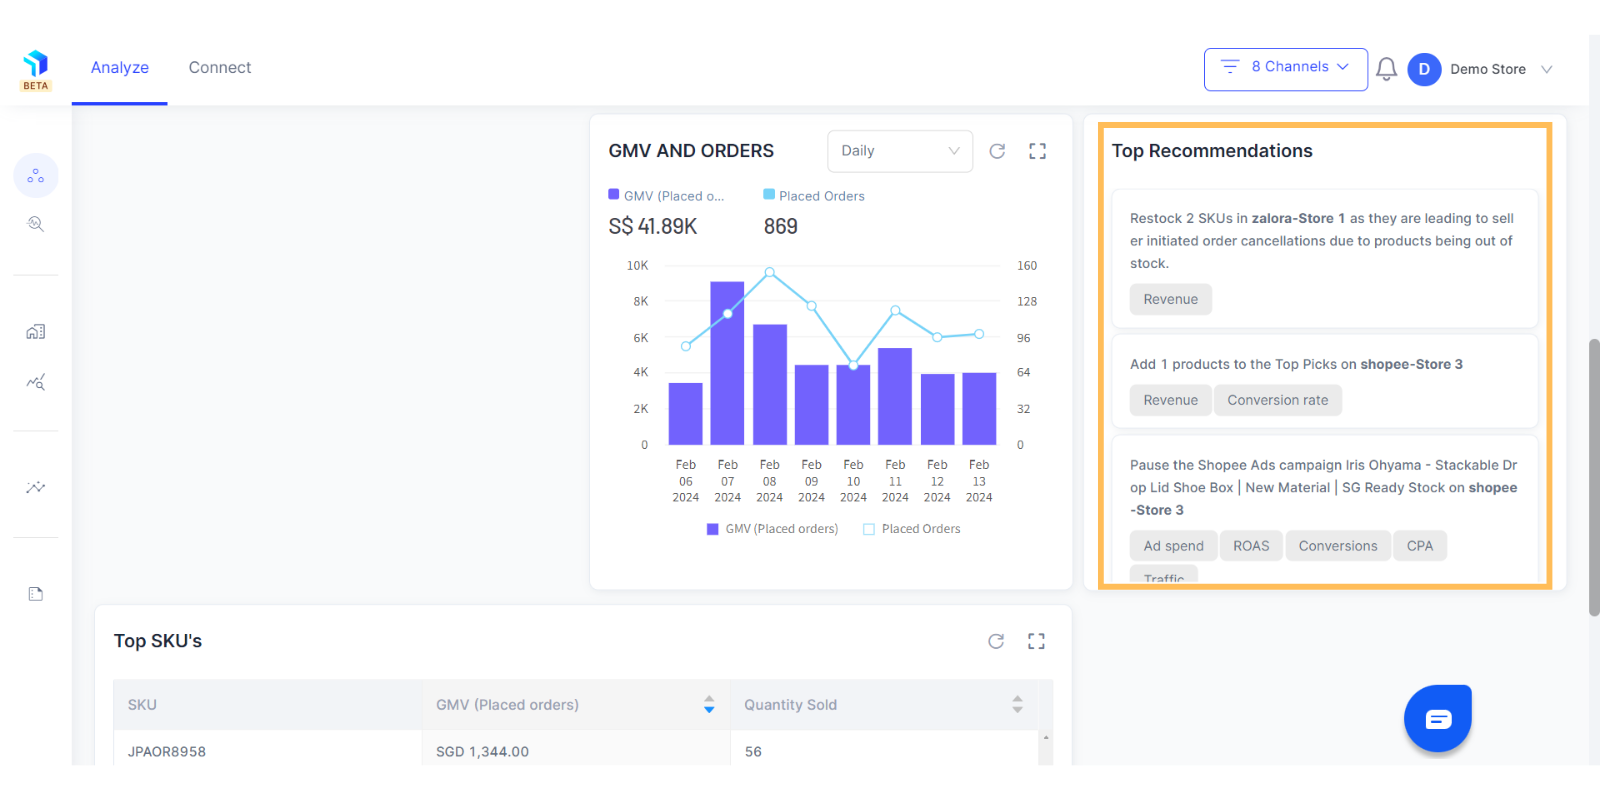
8. The Graas platform deciphers trends and patterns in your data, and derives insights for your business. You can use this highlighted panel below, to track the SKU or Store performance related Insights and Recommendations.
9. You can do a deeper dive into the business metrics, click on the highlighted line below GMV metric, it will take you to Business Deep Dive where you can get a more detailed analysis of your metrics.
You can also explore the Ad Channel and Campaign level performance reports with the Marketing Dashboard or even customize and build your own charts and add the dashboard.