
Chart Builder
With the Chart Builder, Graas allows you to easily build charts for various metrics and combinations tailored to your business needs. You can add more charts/ cards to the dashboard for different reporting purposes, and share dashboards with other team members, and rearrange or delete existing dashboards to stay organized.
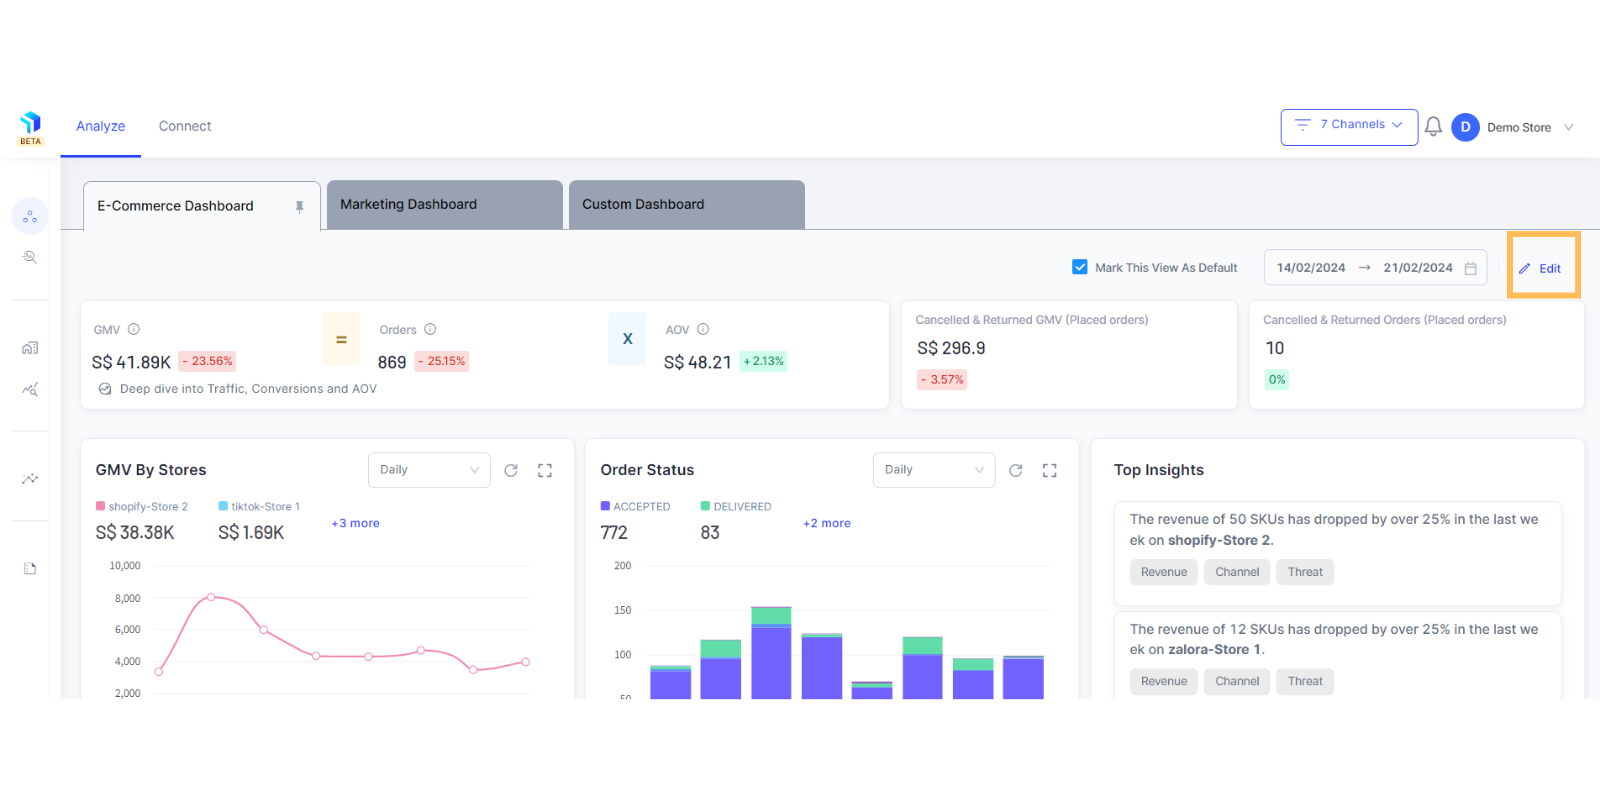
Steps to get to the Chart Builder
Go to Analyze > Workspace > E-Commerce Dashboard/ Marketing Dashboard/ Custom Dashboard > Edit > Chart Builder
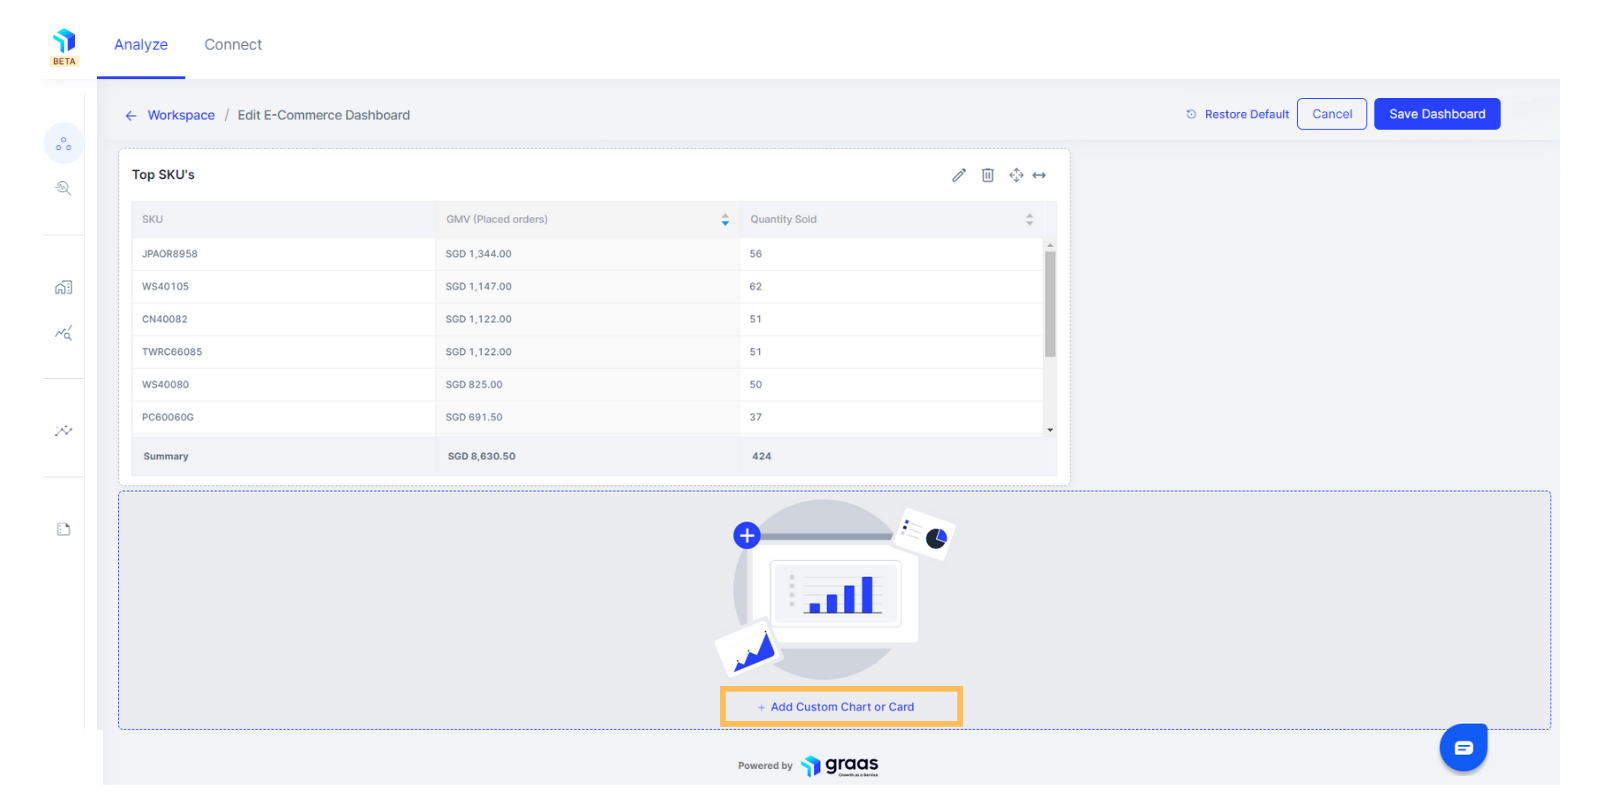
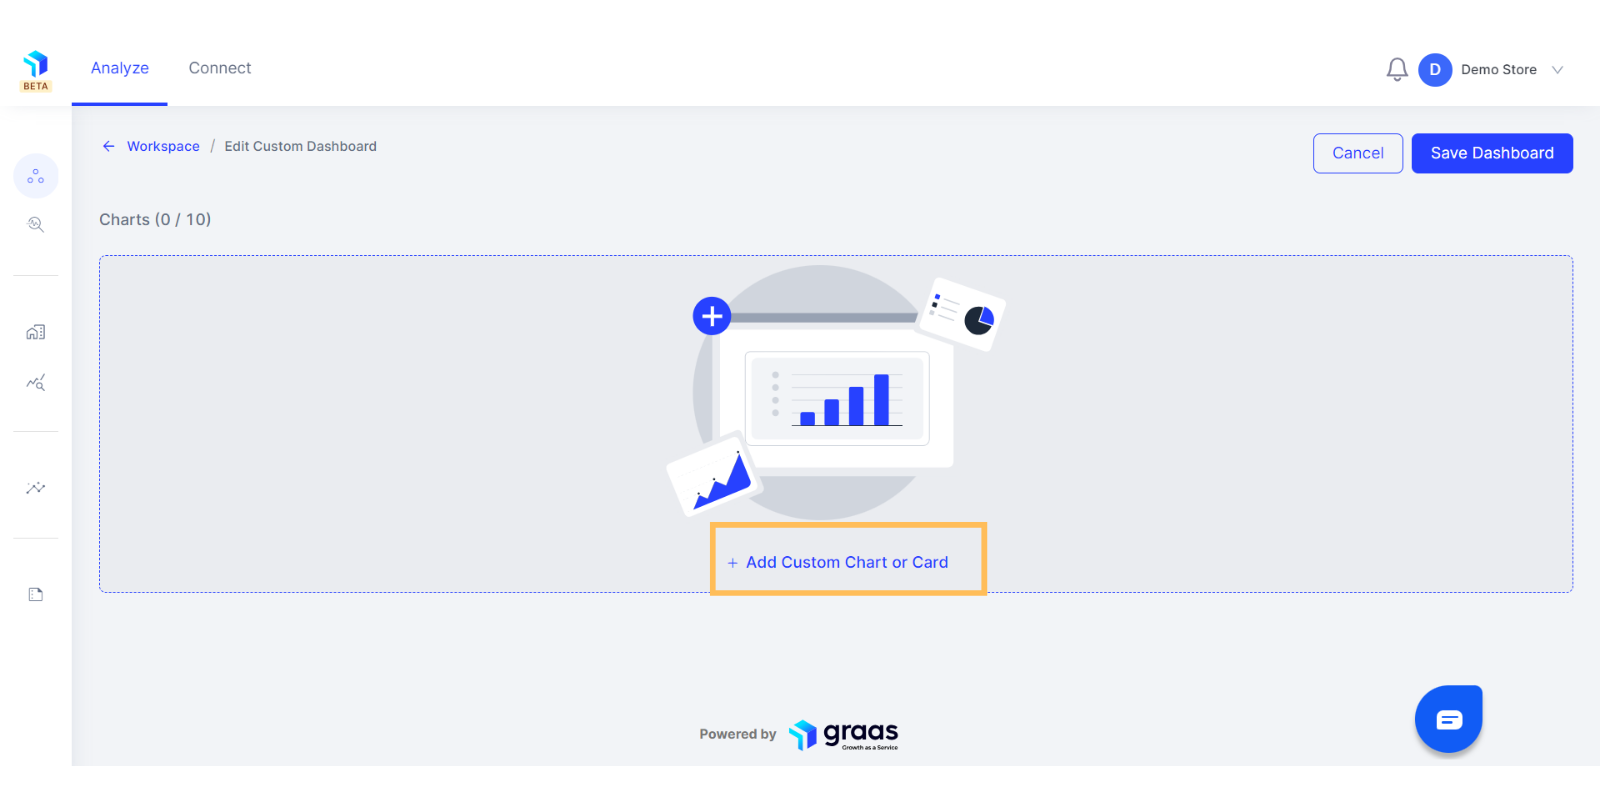
1. Click on the +Add Custom Chart or Card, as shown below.
2. Choose what your axes would represent to plot them against each other. Click on the Metrics dropdown to select the first metric you want included in the chart.
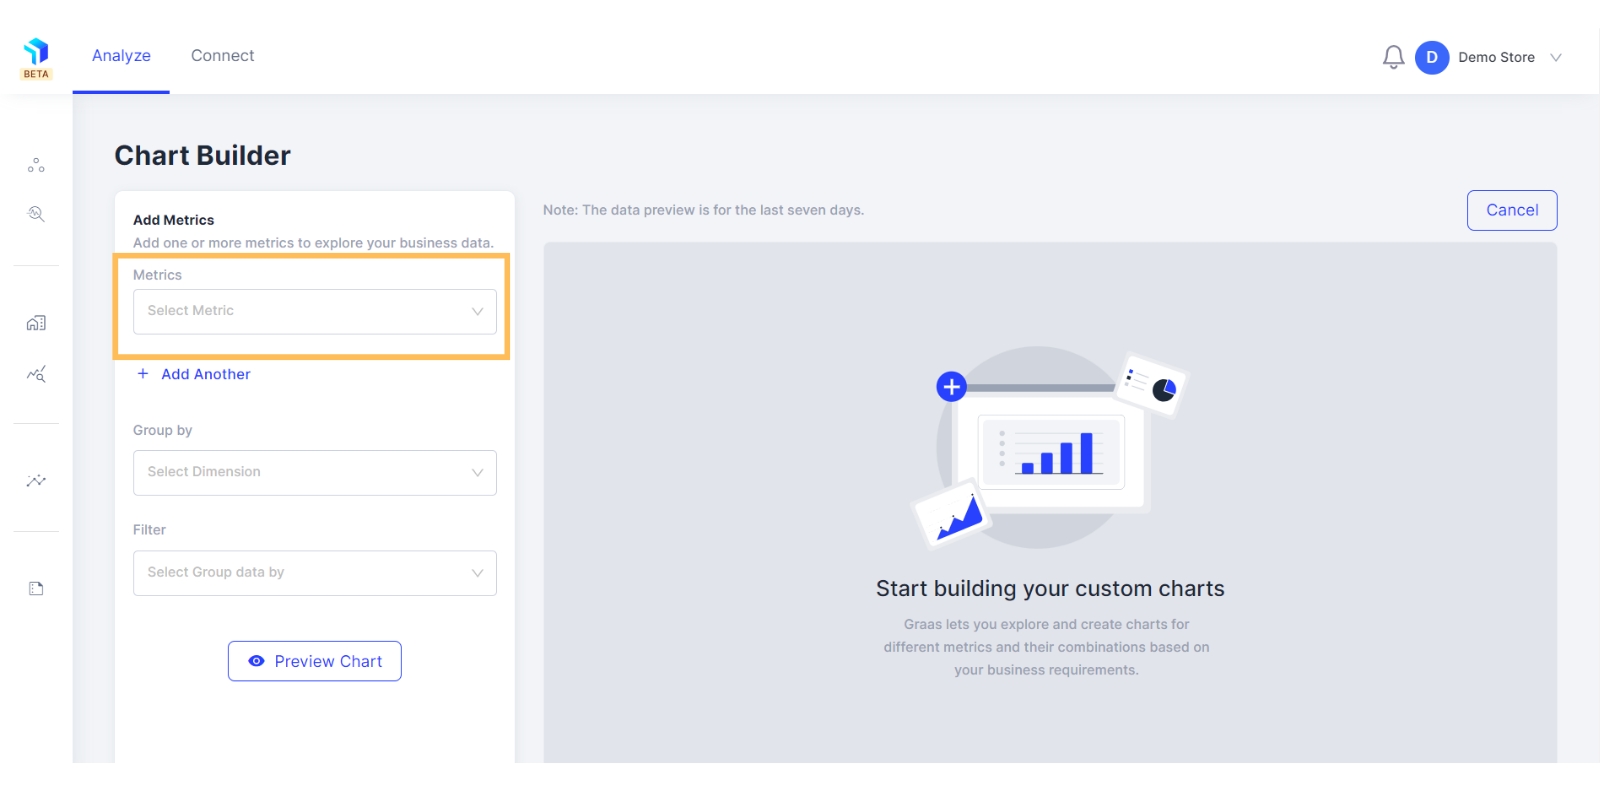
3. Select from the list of metrics you want included in the chart.
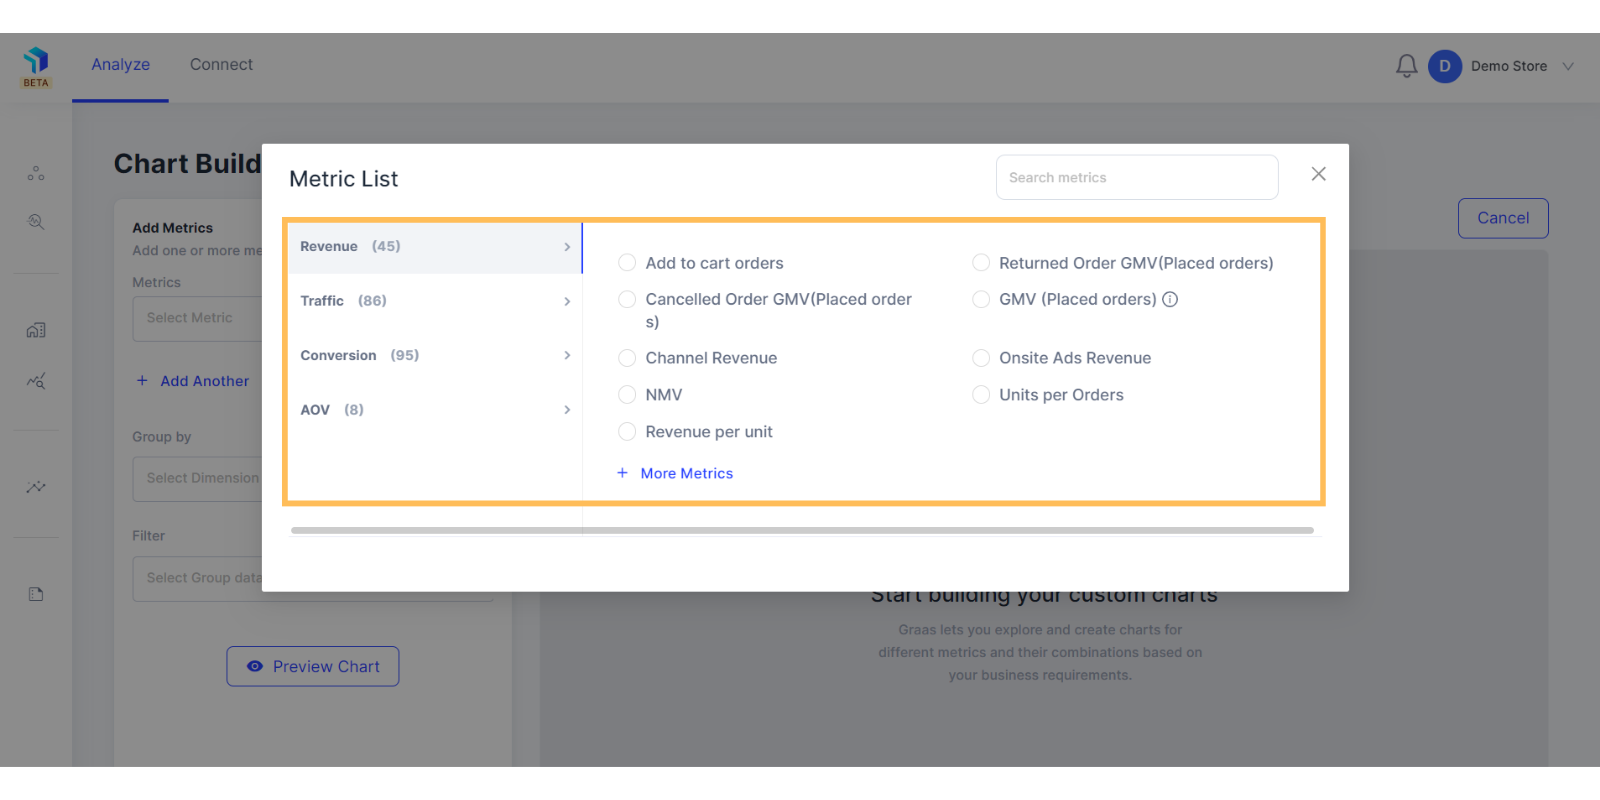
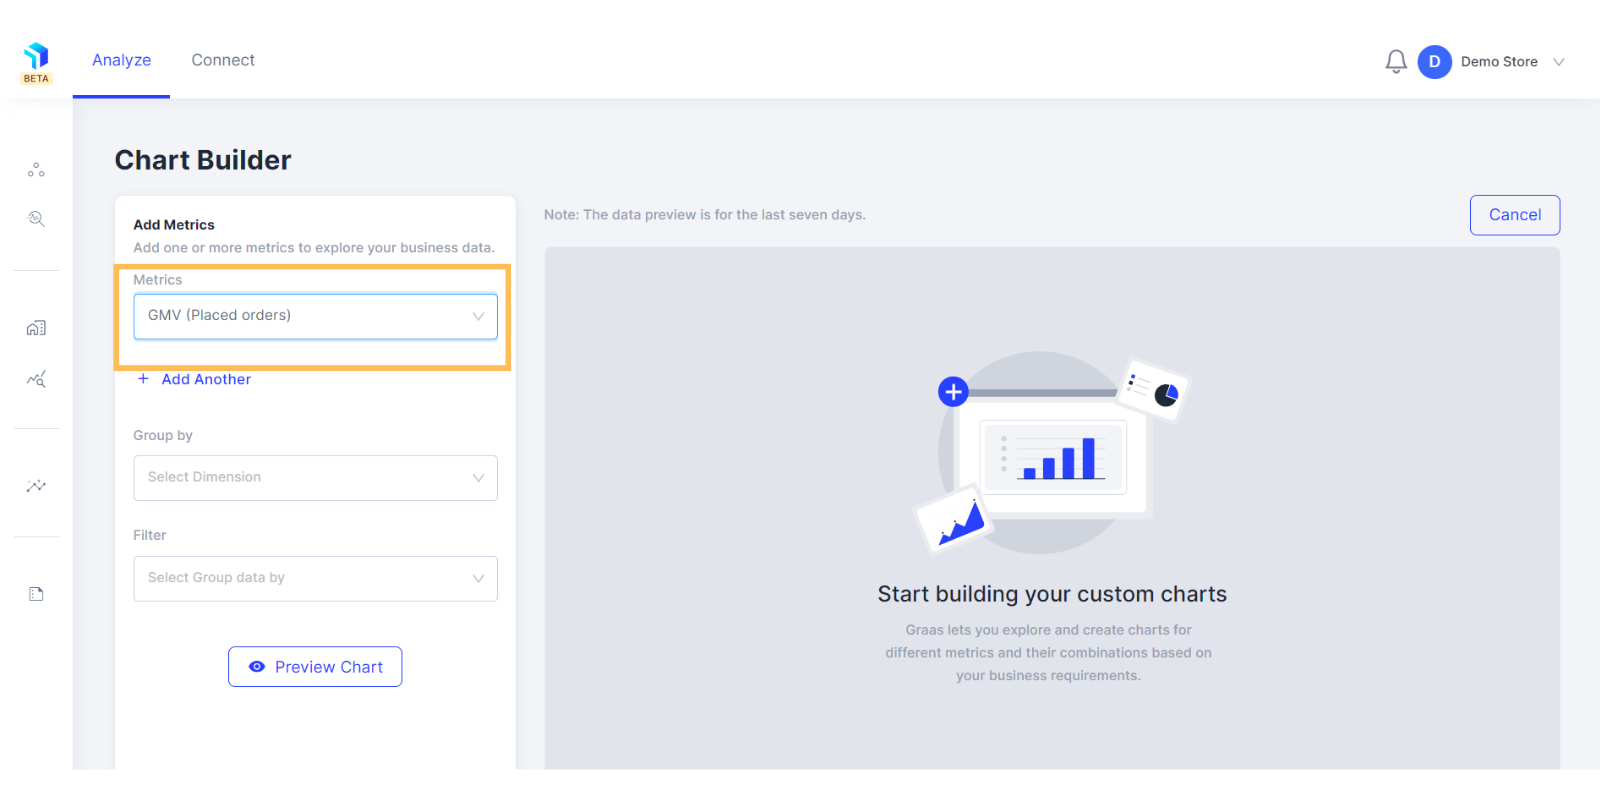
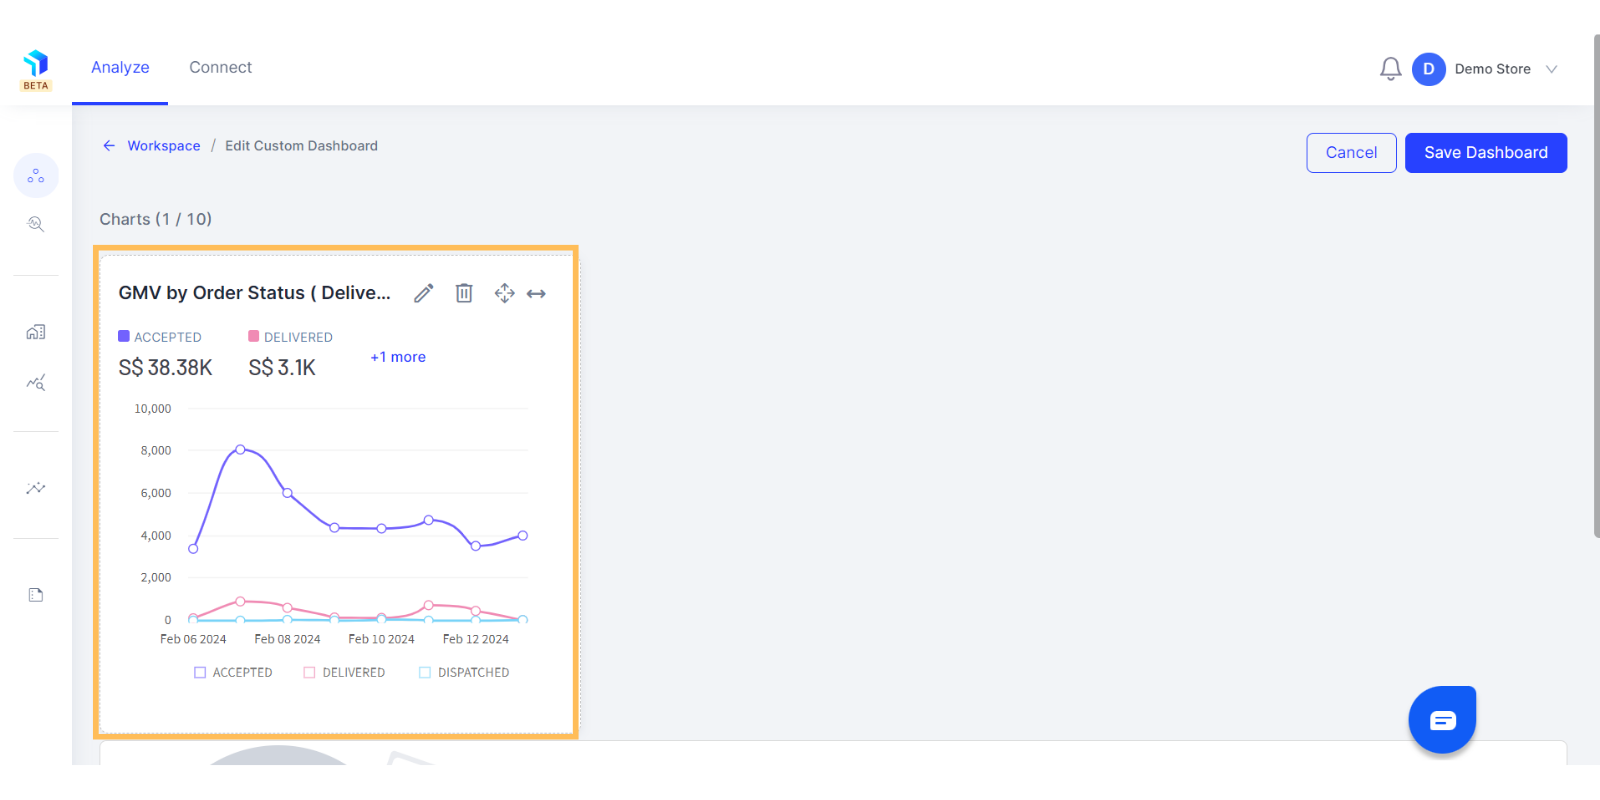
4. For example, if you want to create a chart for GMV by stores but without GMV from returned & canceled orders. First select GMV (Placed Order)
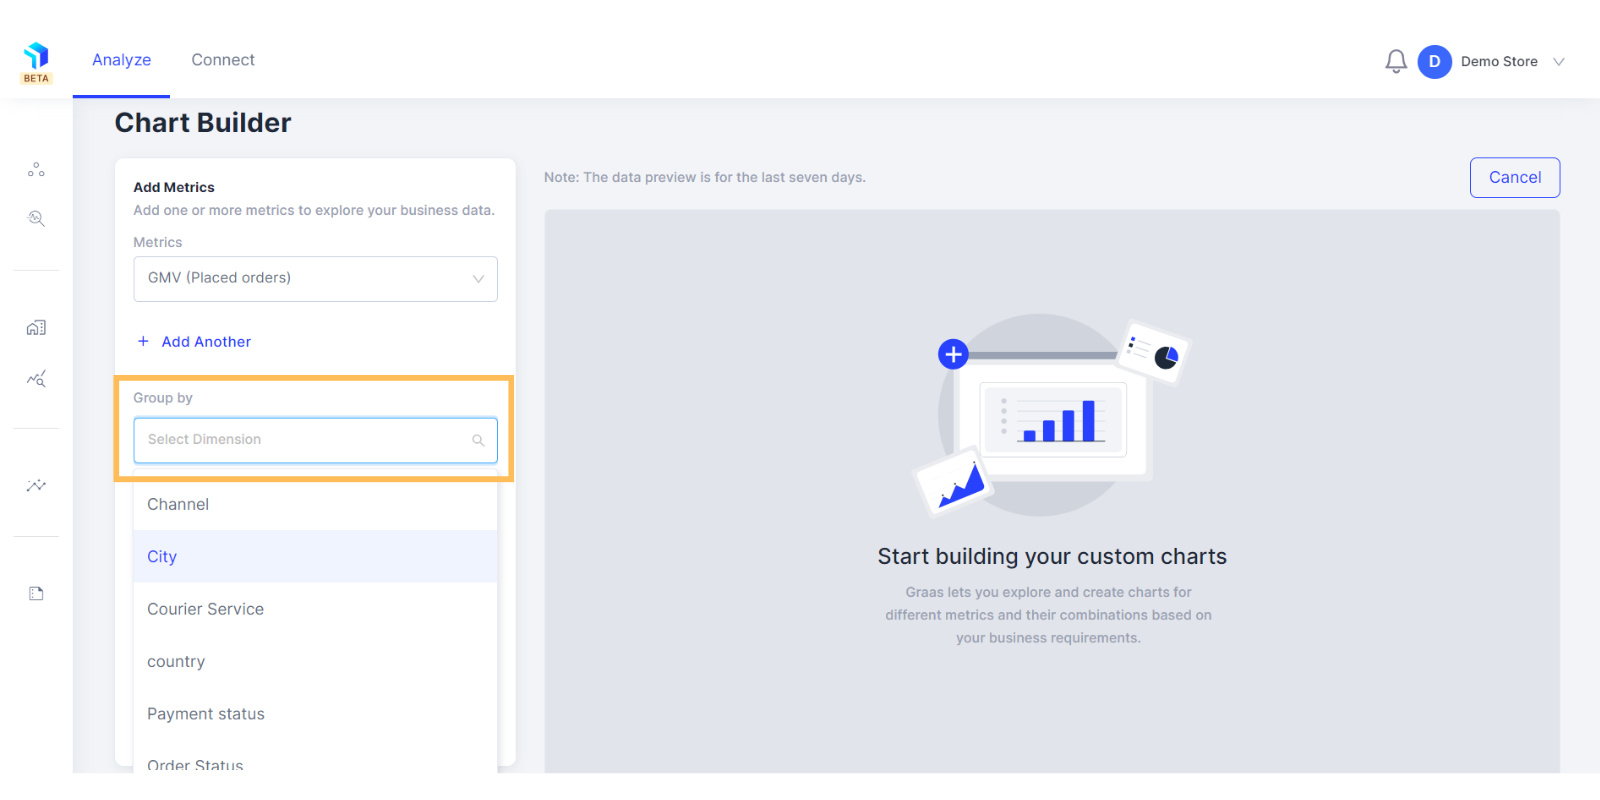
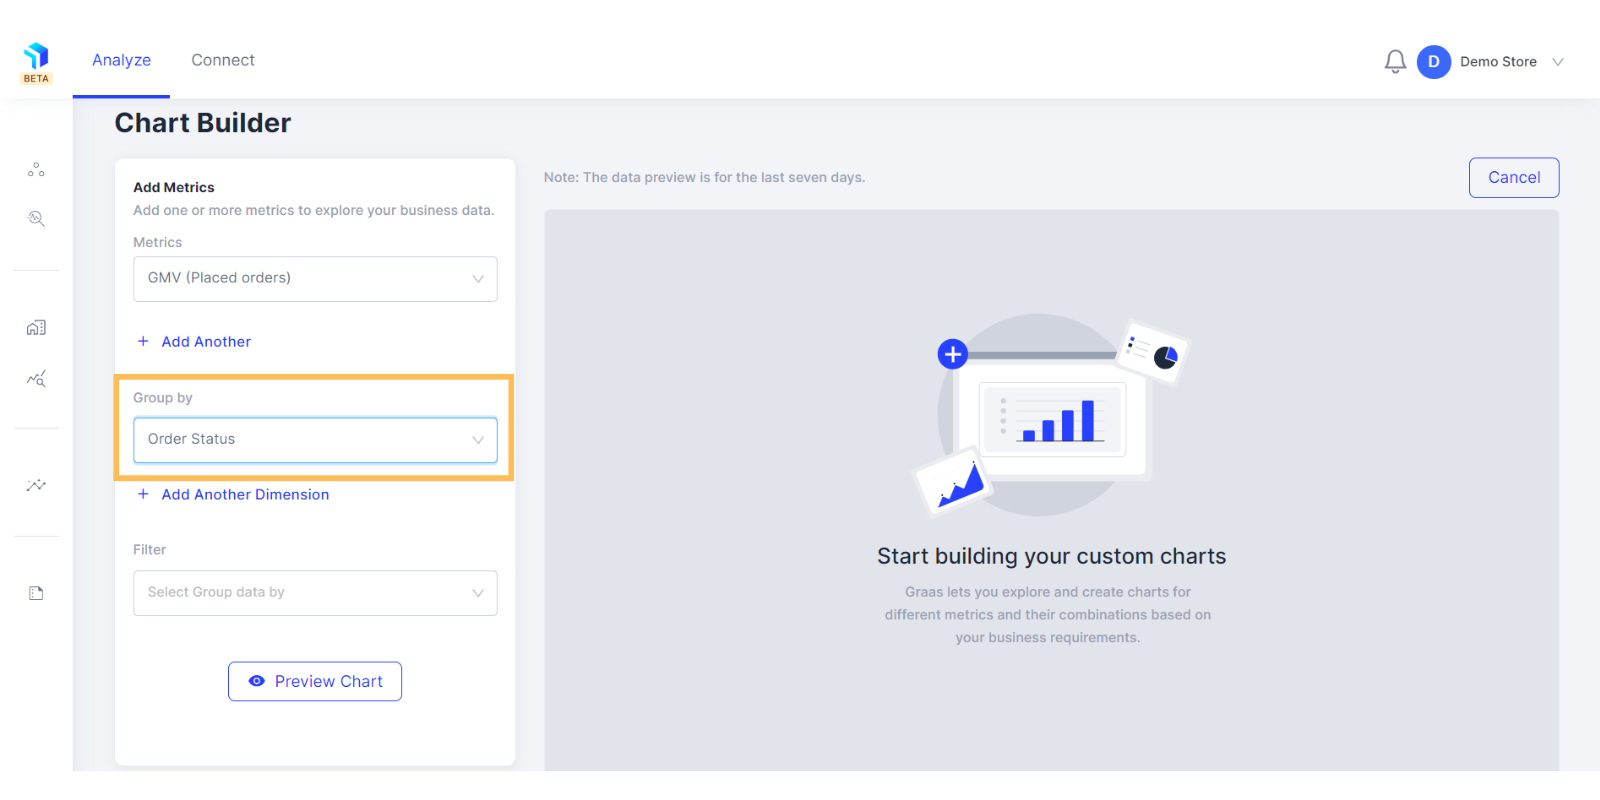
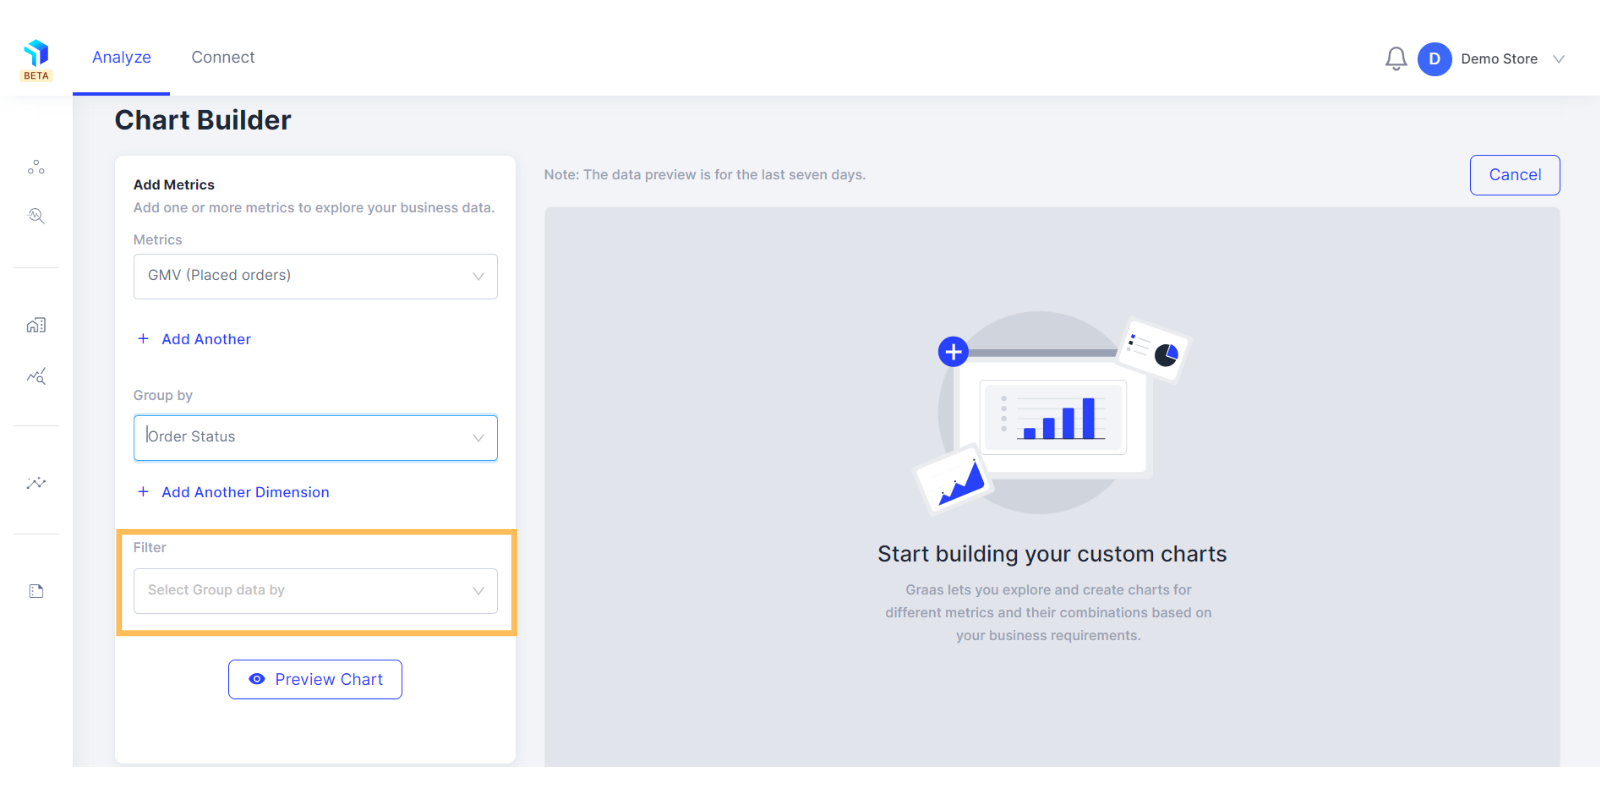
5. Next, select the dimension you want to group your data by. Continuing the above example, Group By Order Status.
6. You have the option to filter your data by specific values as well. You have the option to filter your data by specific values as well. In this case, we are opting to filter the data by Order Status.
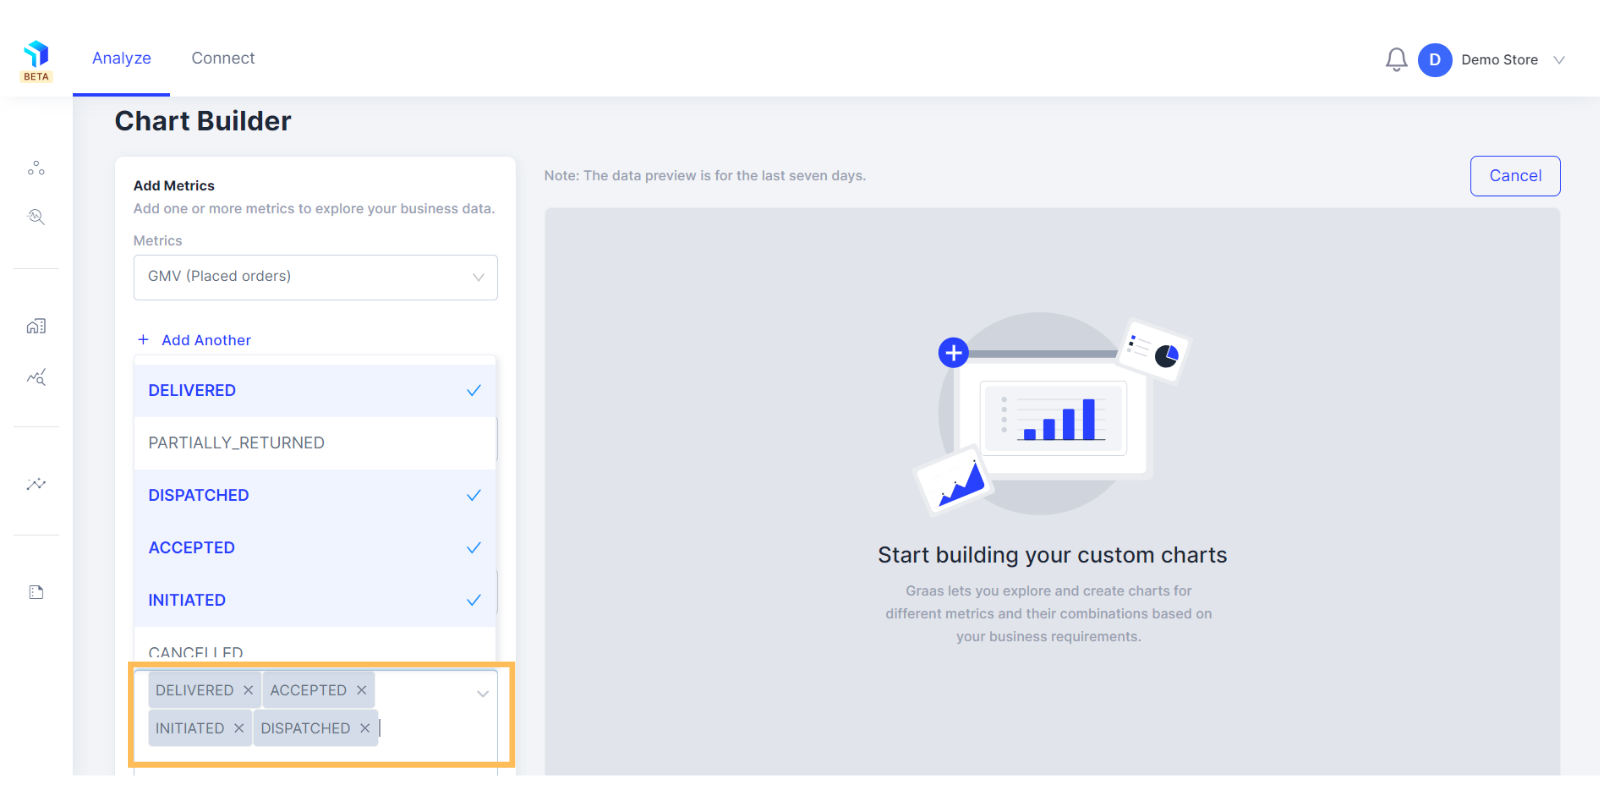
7. To get the accurate GMV for placed orders, we have selected the values- Delivered, Dispatched, Accepted and Initiated for accurate results.
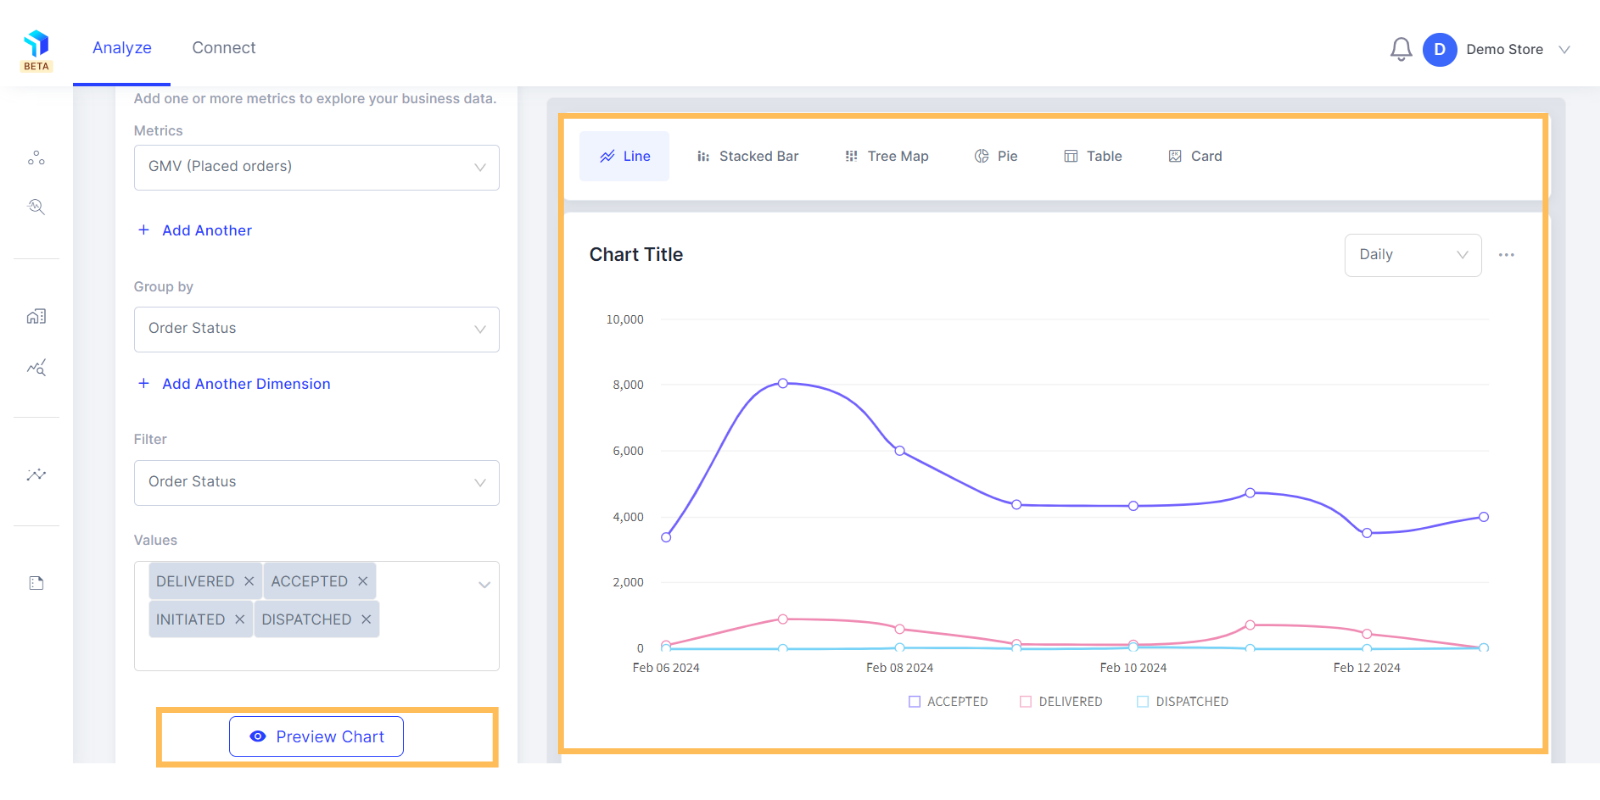
8. Preview your chart in different formats to select the optimal view and customize it to your preference.
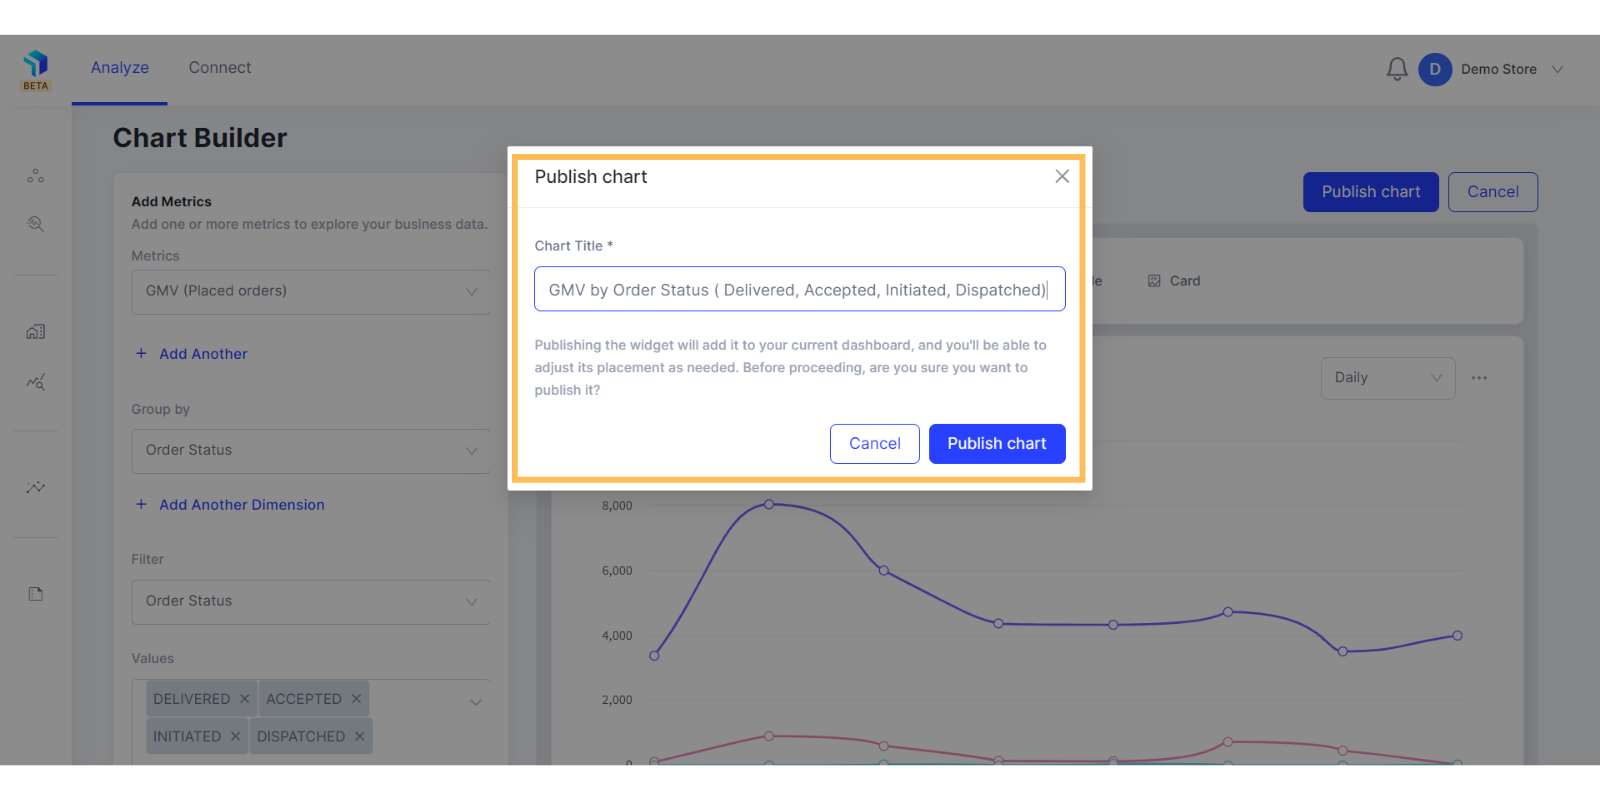
9. Click on Publish to add this chart to your workspace. Before proceeding, give the chart a title name for reference. You will be able to adjust its position and placement as needed.
10. You can save this to the dashboard.
11. If you want to edit your charts or cards,